Investing & Trading Basics
A course in four levels, from ETF basics to machine learning. Each level builds on the one before it, and each article also works on its own. Every graphic here is our own. In the chart levels, they are drawn from synthetic price series and show the shape of a pattern, not a real price history, because a real example would always be one we picked afterwards. The ETF basics use worked calculations and, where stated, our own holdings data with its reporting date.
What this course does not give you: ready-made signals, entry rules or forecasts. What it does give you: the concepts behind them, and for every tool an honest note on what it measures and where it stops working.
- Level 0
ETF basics
15 articles
Before any chart comes the question of what to invest with. This level explains how ETFs are built, how to read a fund name, what costs and taxes add up to, and where broad indices reach their limits.
-
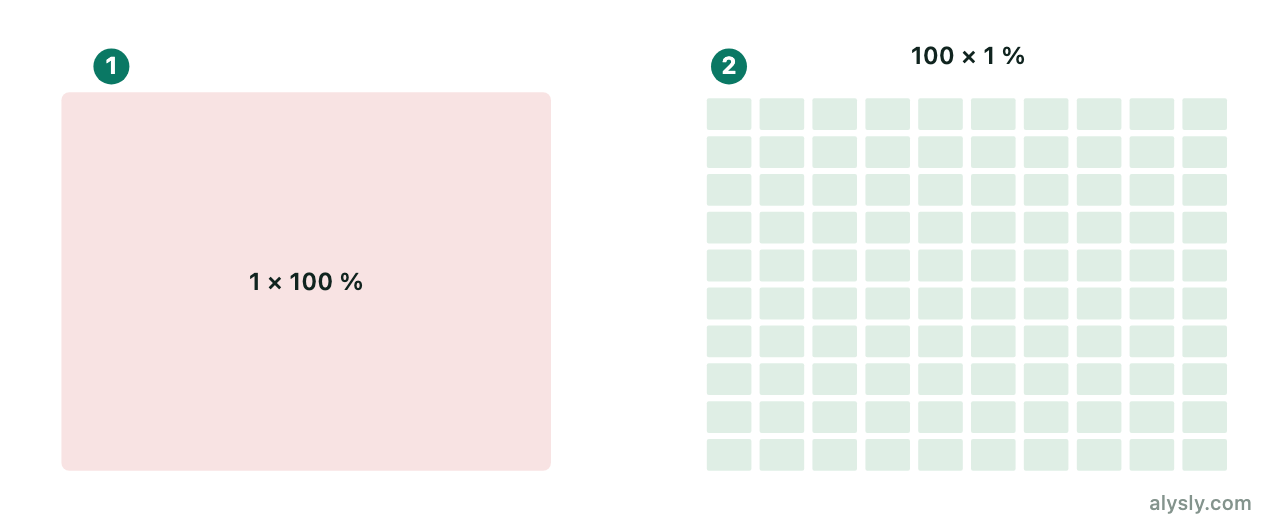
What are ETFs? Simply explainedAn ETF bundles many stocks into one fund that trades on an exchange like a single share. How ETFs work, what they cost and how to see what they hold.
-
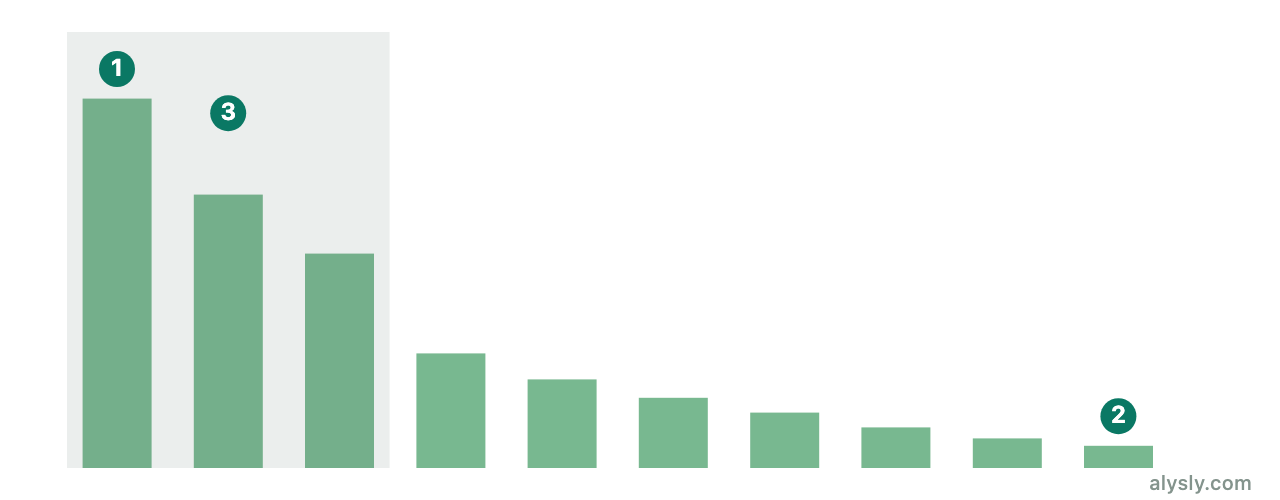
What is an index? Rules instead of picksAn index is a rules-based basket of securities — the thing an ETF tracks. How the rules work, why weights follow market value, and what that means for concentration.
-
ETFs for beginners: the five basic decisionsTime horizon, brokerage account, choice of index, savings plan or lump sum, and how to handle market declines: the five points that shape an ETF start.
-
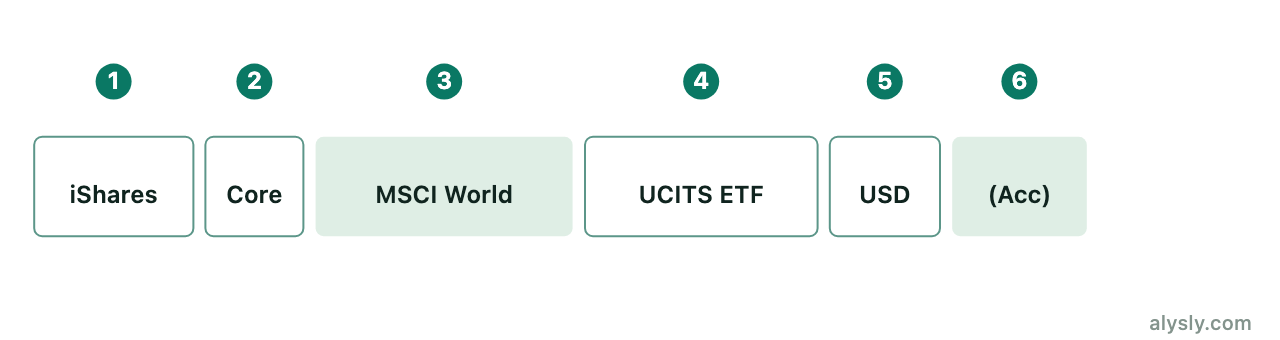
ETF names decoded: what each part meansiShares Core MSCI World UCITS ETF USD (Acc) – every part of an ETF name explained.
-
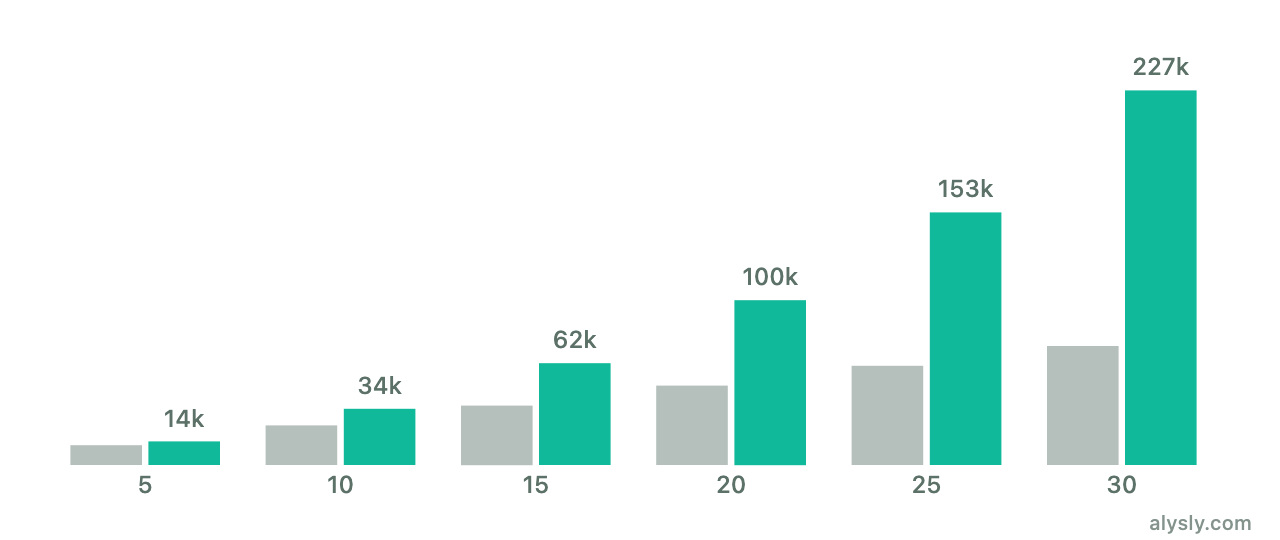
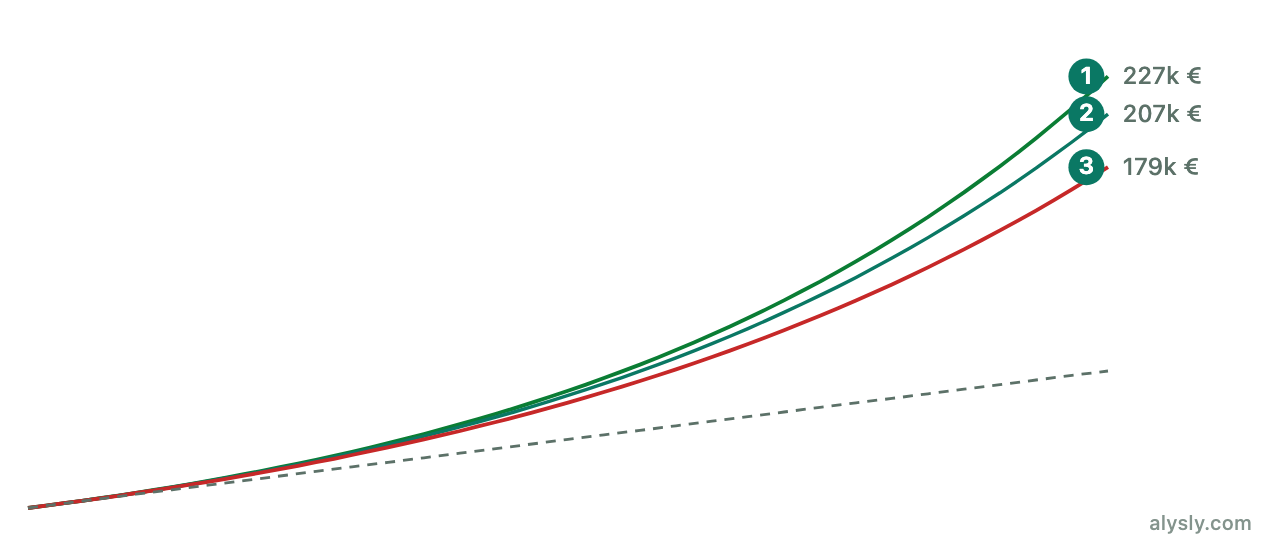
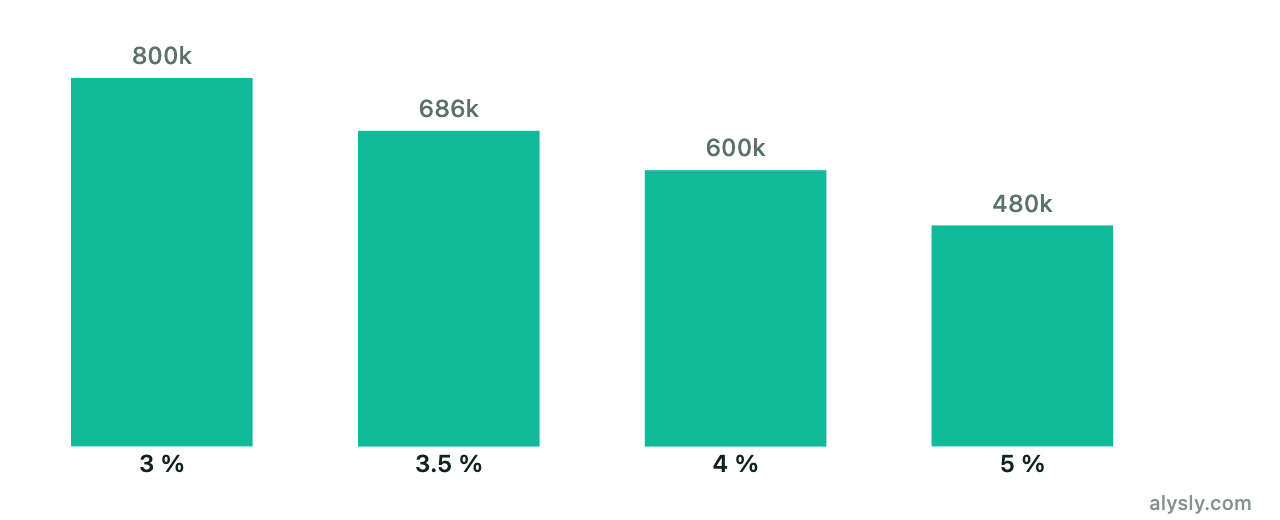
ETF fees: TER and hidden costsWhat an ETF really costs: TER, spread, order fees and tracking difference – and what half a percentage point does over 30 years.
-
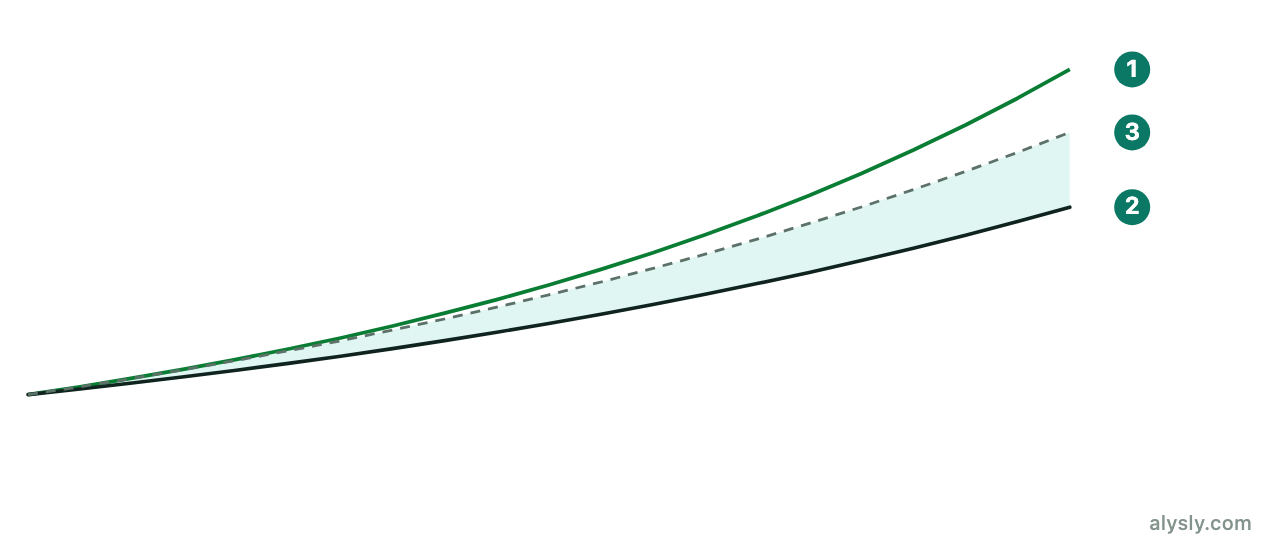
Distributing or accumulating ETFs? The differenceDistributing ETFs pay out dividends, accumulating ETFs reinvest them automatically. How the two differ in reinvestment, income and tax.
-
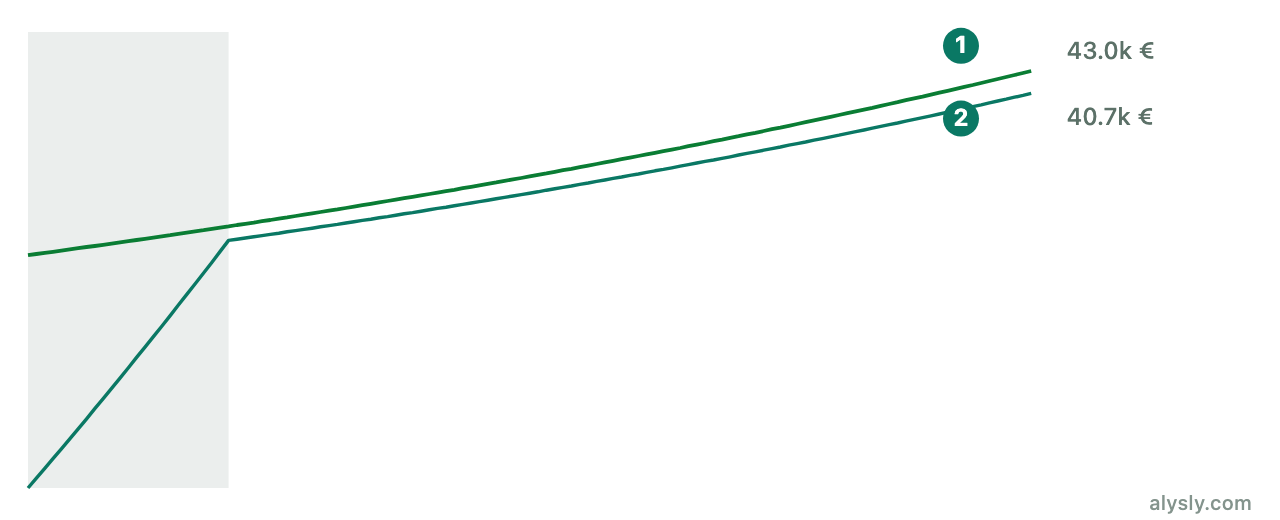
Savings plan or lump sum: what historical data showsInvest a sum at once or spread it out? What historical comparisons show, where their limits are and how to run both in the calculator.
-
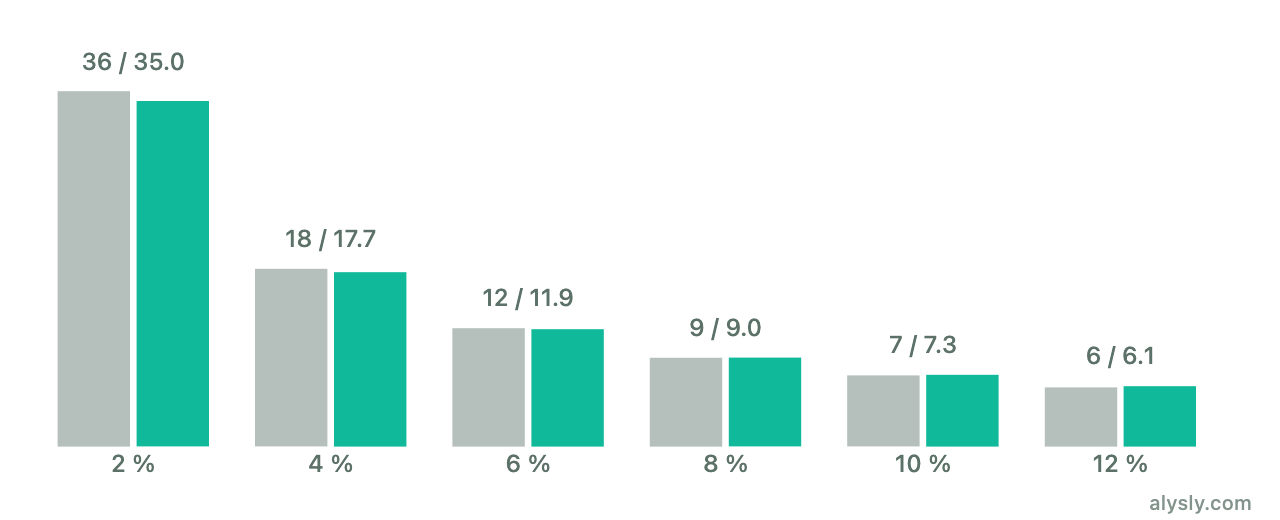
The Rule of 72: estimating doubling timeA rule of thumb for compounding: 72 divided by the annual return gives roughly the years until a sum doubles – with its limits and the exact calculation.
-
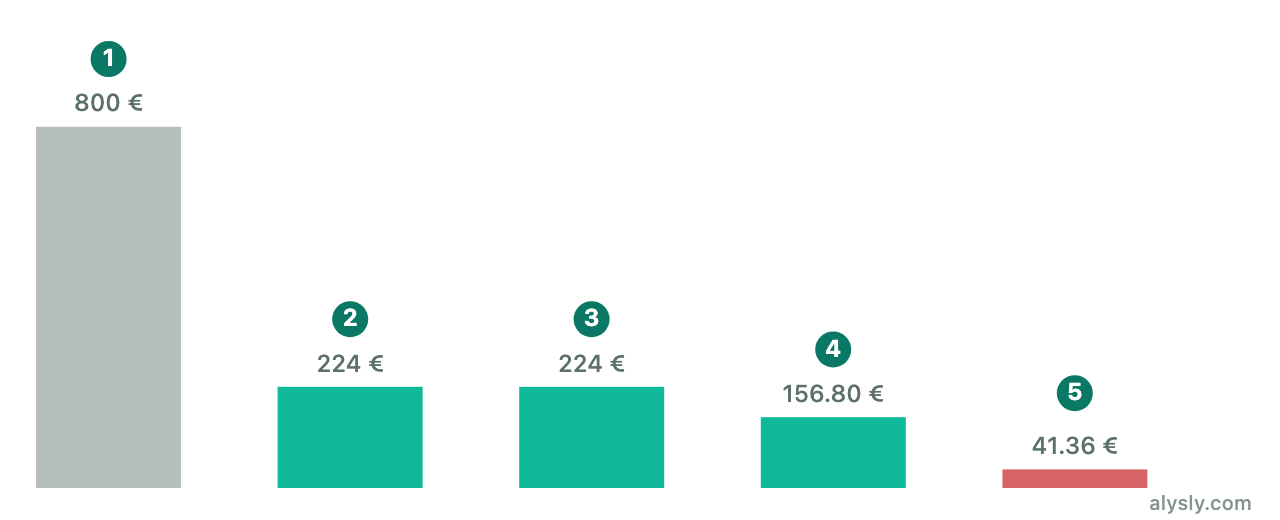
ETFs & tax in Germany: the essentialsTeilfreistellung, Vorabpauschale and the saver's allowance: how ETFs are taxed in Germany, explained clearly.
-
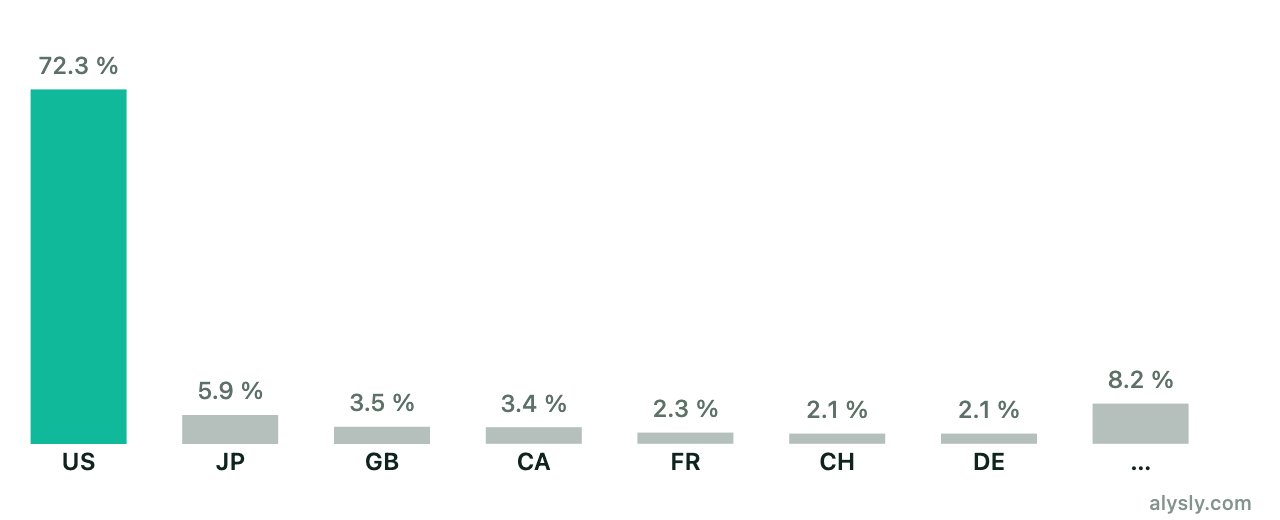
MSCI World criticism: how big is the US concentration?The MSCI World is criticized for its heavy US weighting. The current breakdown by country and sector, and which fund types change the weighting.
-
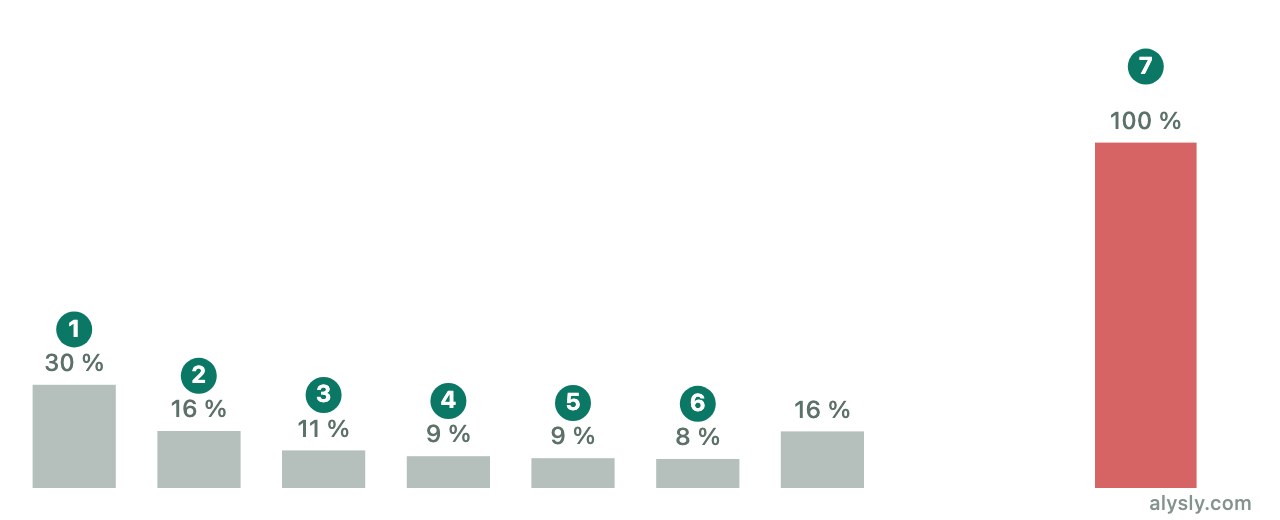
Sector ETFs: a single industry in one fundSector ETFs bundle one industry – like consumer staples. What that means for diversification and volatility, with a live example.
-
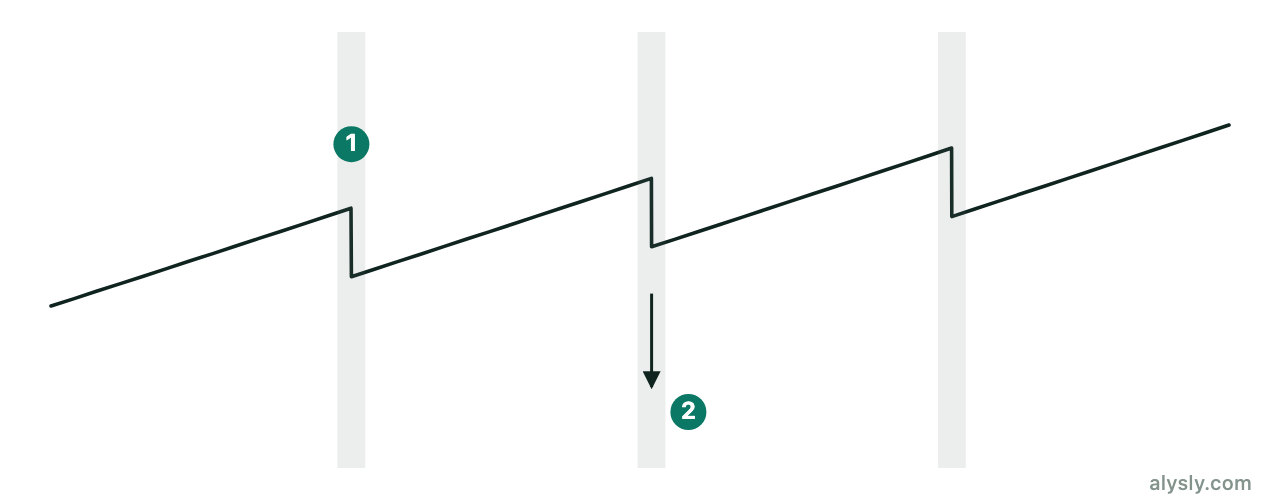
Dividend ETFs: payouts and required capitalHow distributing ETFs generate regular payments, where the payout comes from and how large a portfolio must be for a given amount.
-
Factor ETFs: Value, Quality, Growth & Small CapBeyond the plain MSCI World: what value, quality, growth and small-cap factor ETFs actually hold, with live holdings.
-
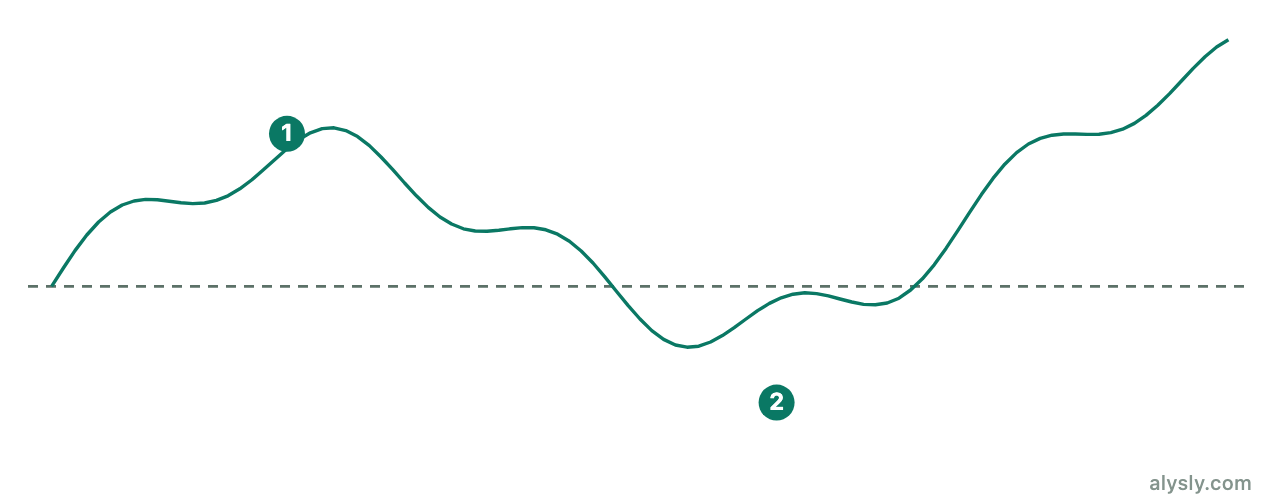
Small Cap Value: a factor premium with long dry spellsSmall and cheaply valued companies added return in historical studies, but not in every decade. The factor ETFs in the catalog with their holdings.
-
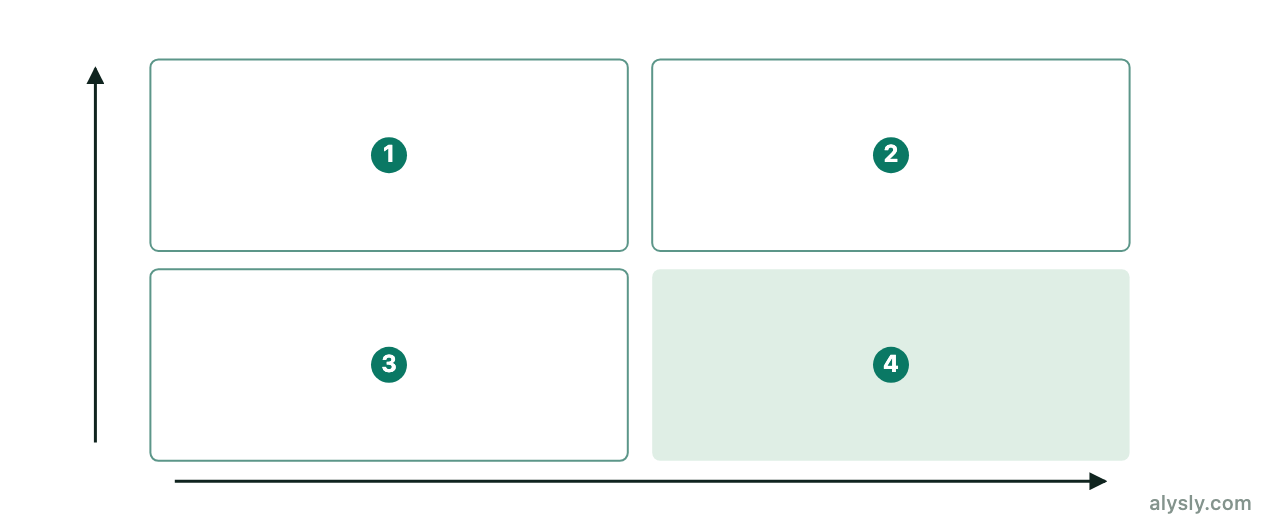
The pension gap: calculating capital needs and withdrawalsHow much capital a given retirement budget requires and how long a portfolio lasts with regular withdrawals – with two calculators.
-
What are ETFs? Simply explainedAn ETF bundles many stocks into one fund that trades on an exchange like a single share. How ETFs work, what they cost and how to see what they hold.
- Level 1
Reading charts
7 articles
Price displays, candles, trends, zones and volume — plus the arithmetic that comes before any pattern: how much a single position may cost you. Without this level, everything after it is decoration.
-
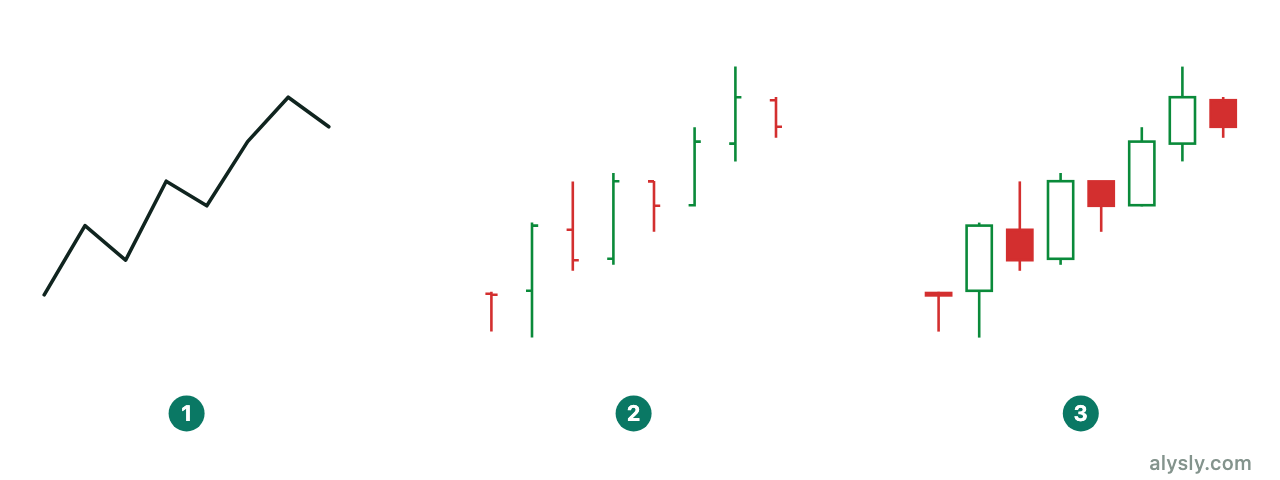
How to Read a ChartChart types, timeframes, axes – and what a chart always leaves out.
-
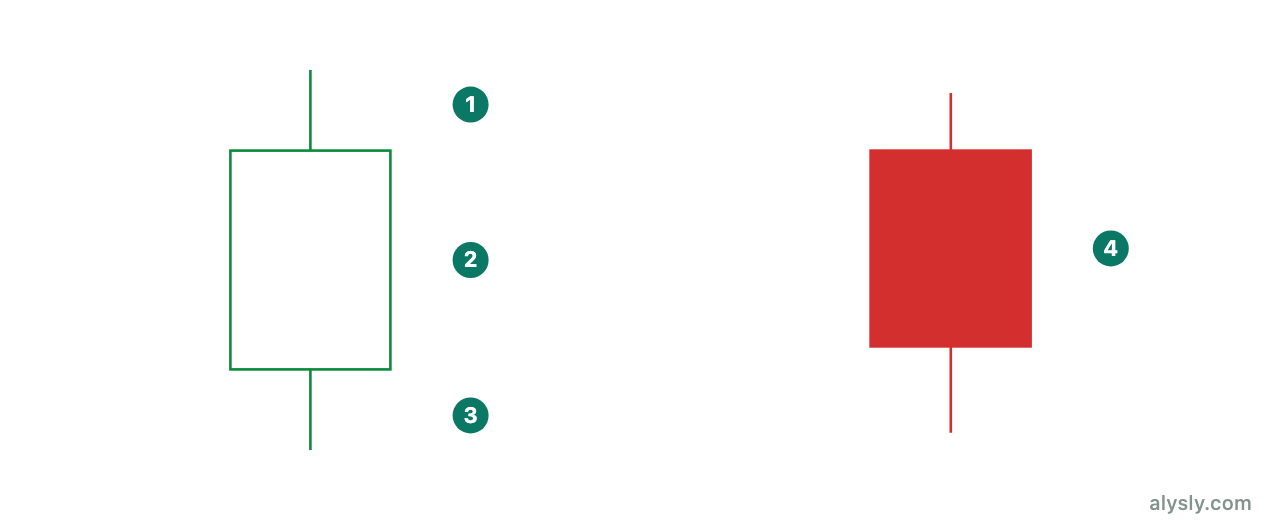
Reading Candles: Body, Wick, ColorHow a candle is built, the body-to-wick ratio – and what gets lost.
-
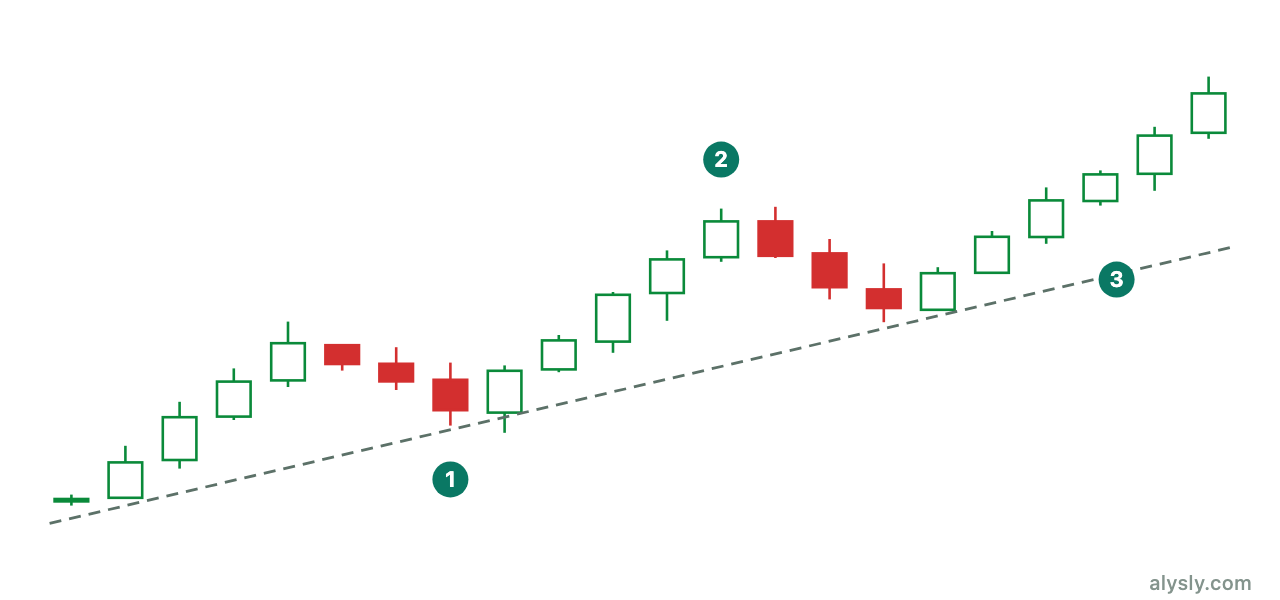
Trend, Trendline, ChannelHigher highs, higher lows – and why trendlines bend more easily than they look.
-
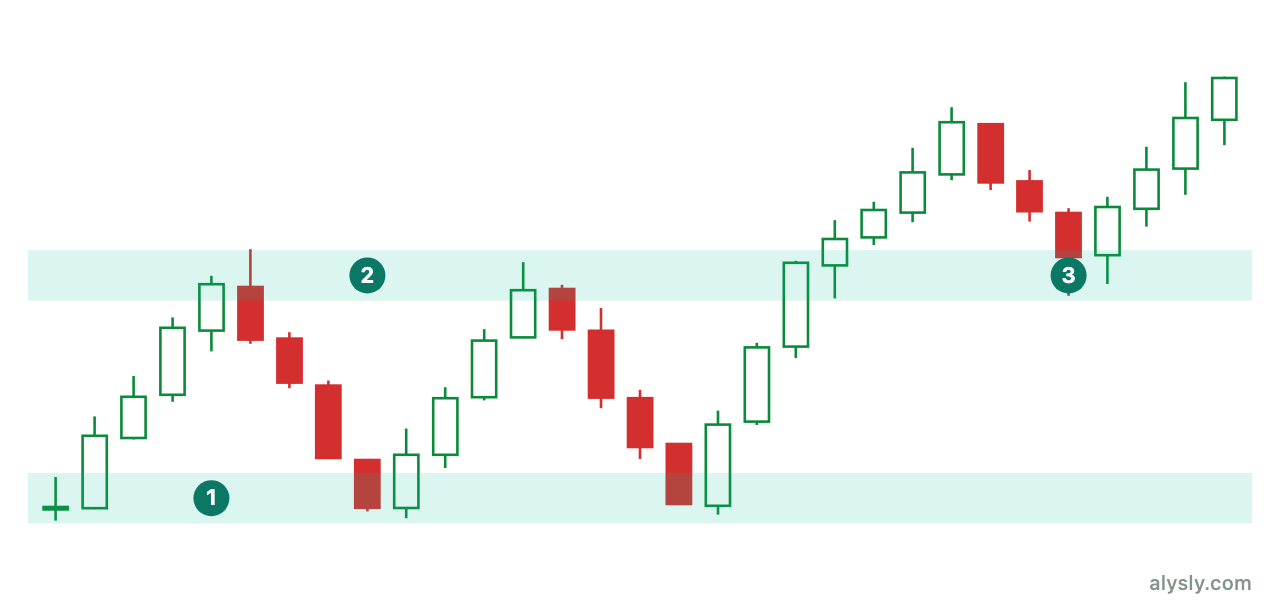
Support and ResistanceZones instead of lines, role reversal, round numbers – and where these areas come from.
-
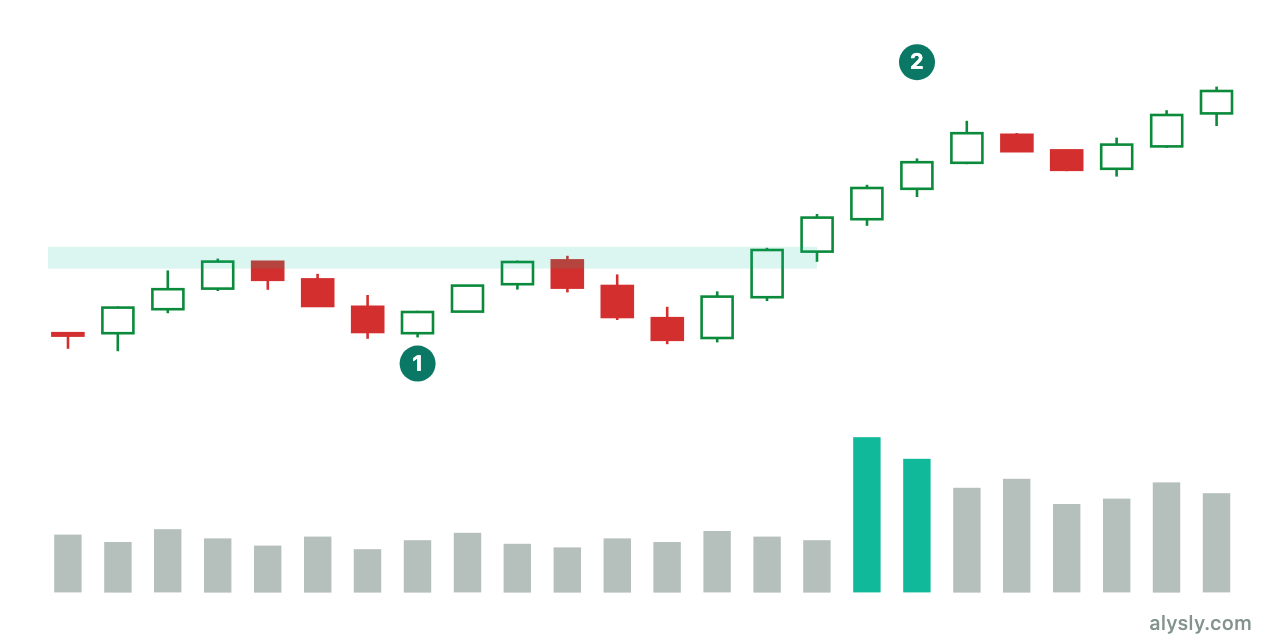
Volume: The Second Opinion on PriceVolume confirms moves – except where it is not centrally recorded at all.
-
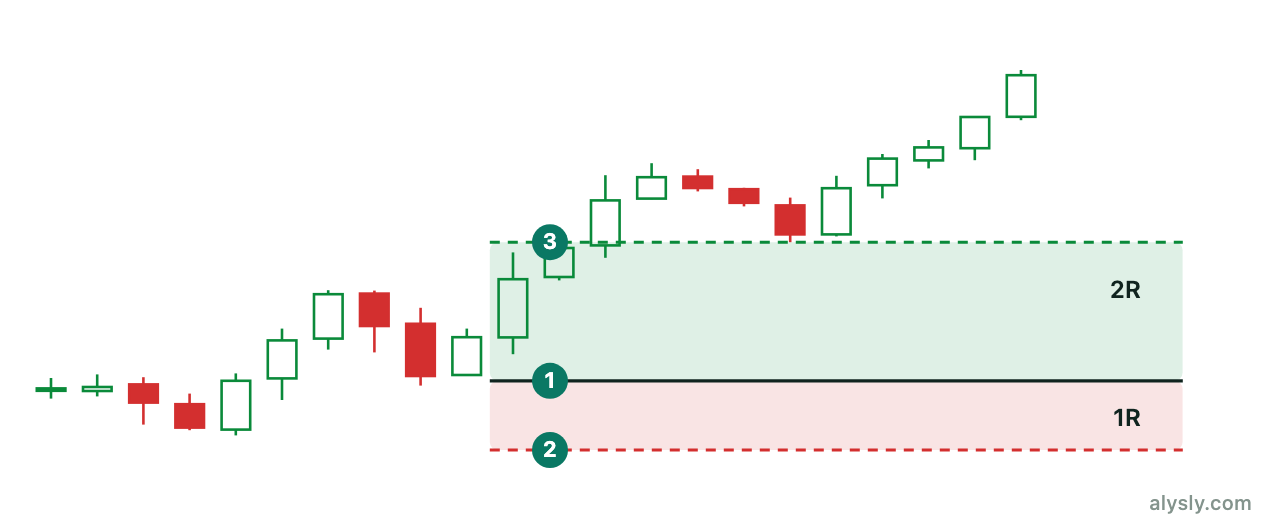
Risk, Stops and Position SizingThinking in R, sizing from the stop – and why losses cost more than they look.
-
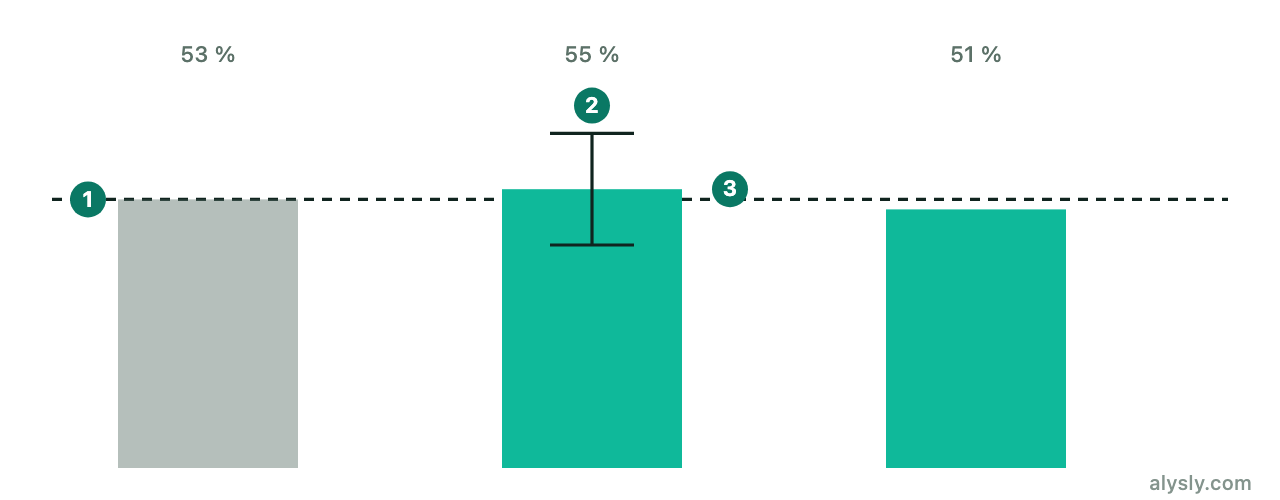
What Technical Analysis Can and Cannot DoBase rates, selection bias, self-fulfillment – a sober assessment.
-
How to Read a ChartChart types, timeframes, axes – and what a chart always leaves out.
- Level 2
Patterns & indicators
9 articles
Candlestick patterns, chart formations, moving averages, oscillators and volatility measures — each with what it measures and what it cannot do. The level closes with the question of how to test a pattern at all.
-
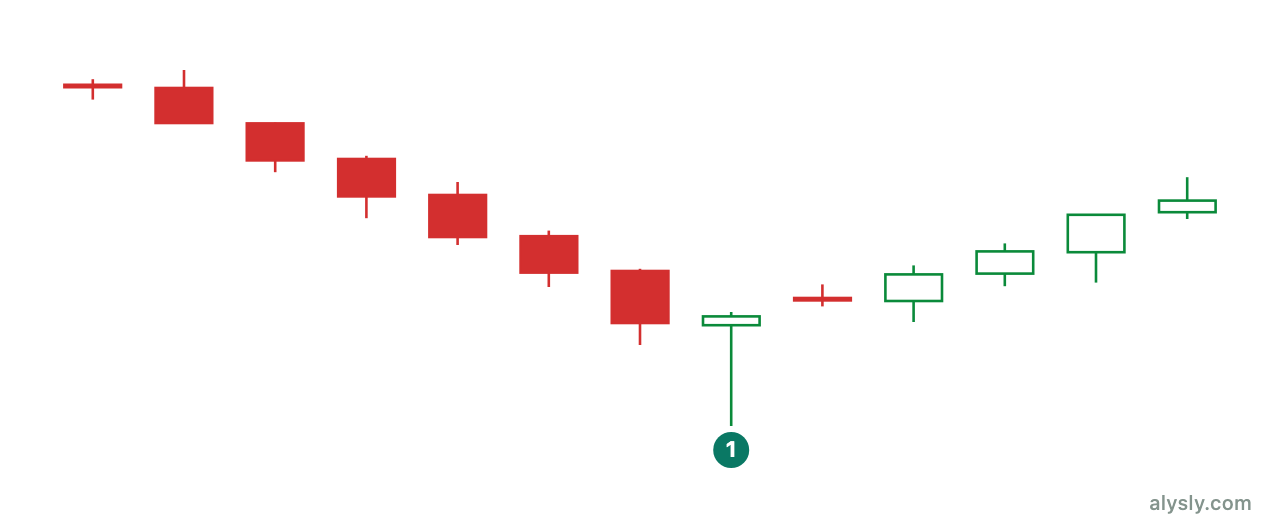
Candlestick Reversal PatternsHammer, engulfing, star formations – construction, meaning, preconditions.
-
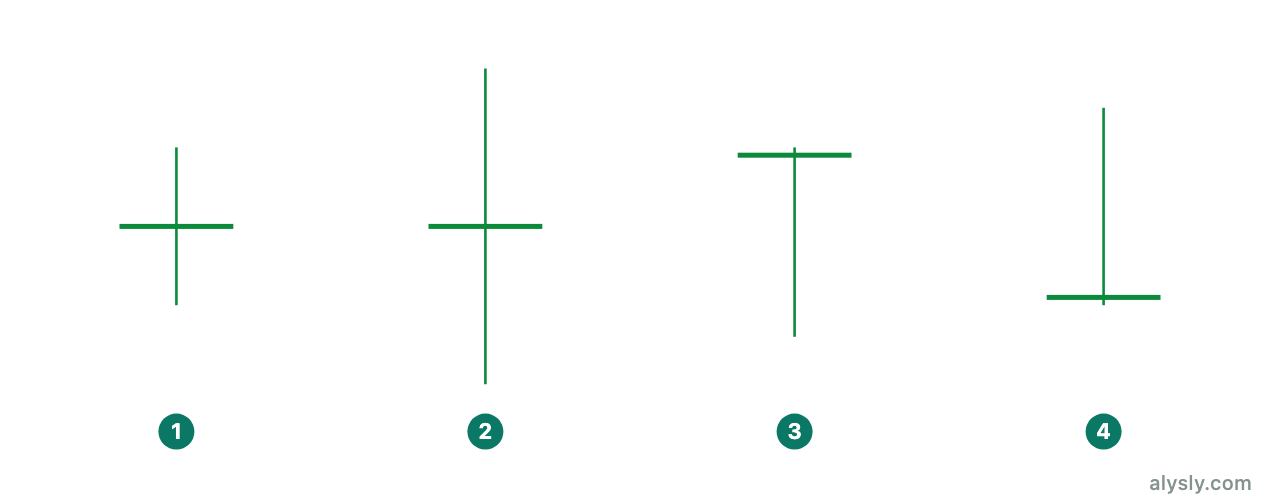
Continuation Patterns and the Doji FamilyDoji, marubozu, soldiers and crows – indecision or continuation.
-
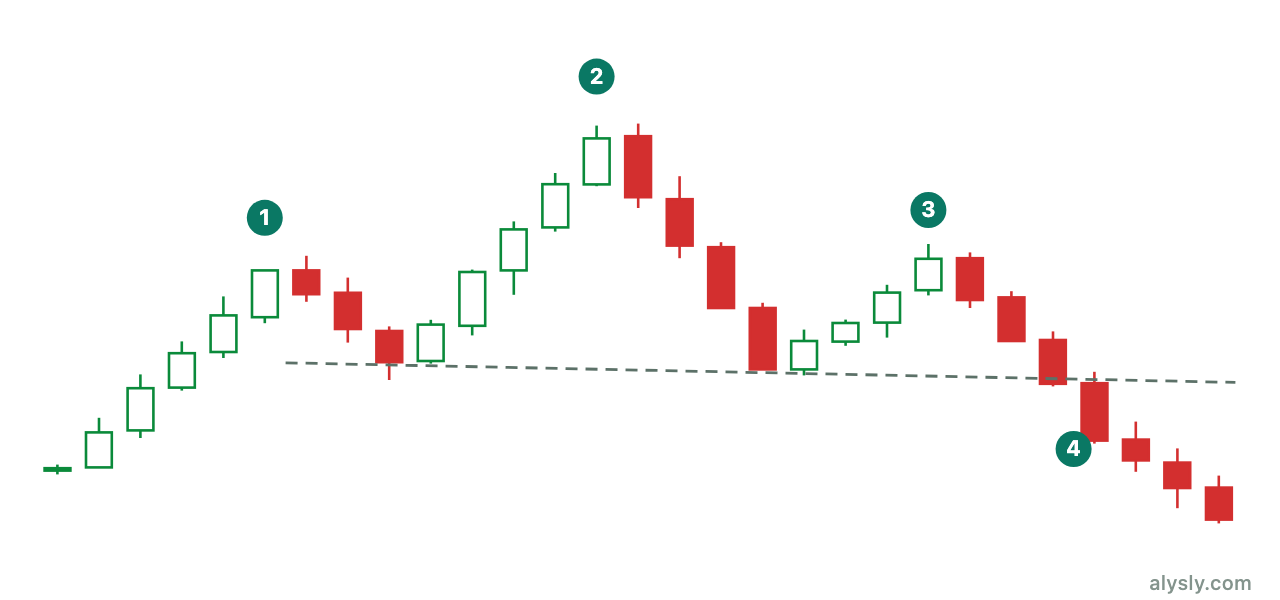
Reversal Chart PatternsH&S, double top, double bottom, rounding bottom – and what their targets are worth.
-
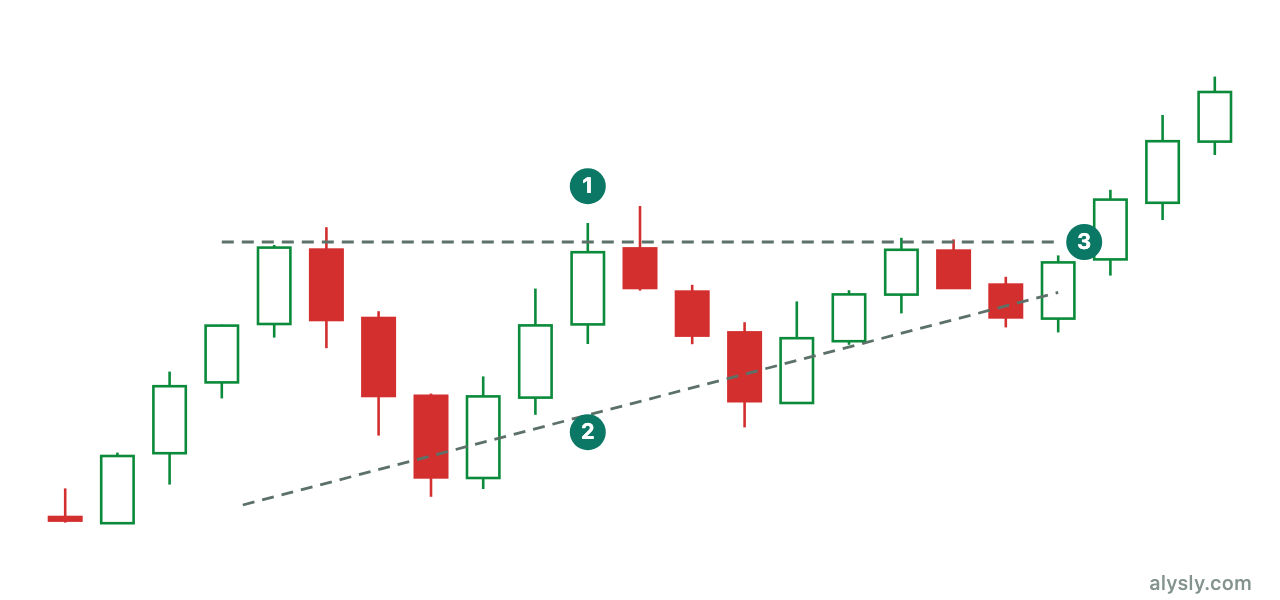
Continuation Chart PatternsTriangles, flags, pennants, wedges, rectangles – pauses in a trend.
-
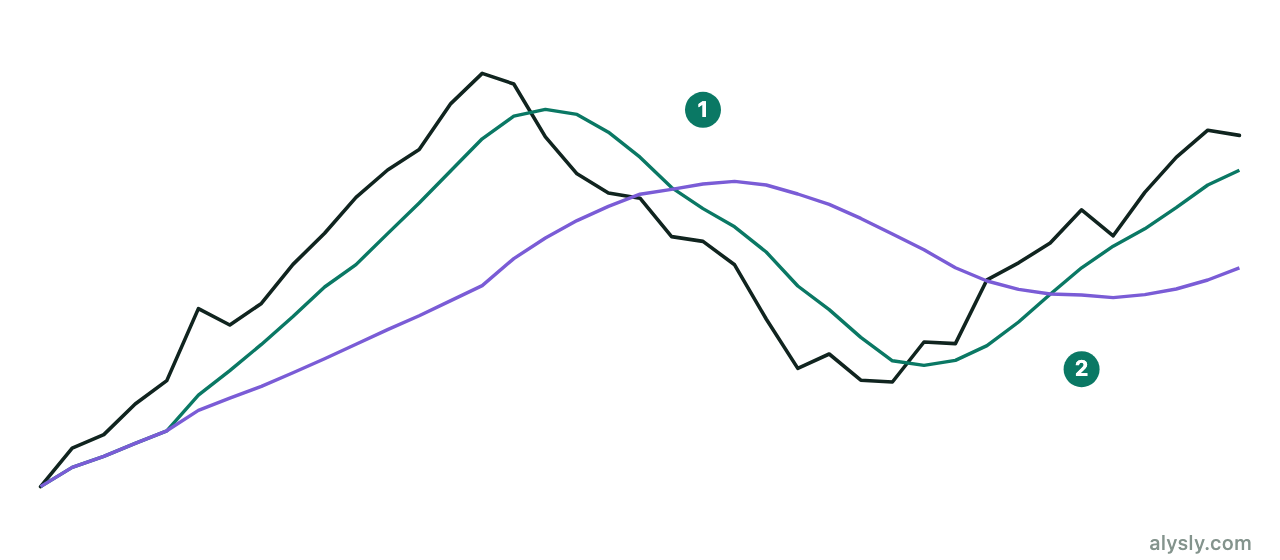
Moving AveragesSMA, EMA, crossovers – smoothing and its price: lag.
-
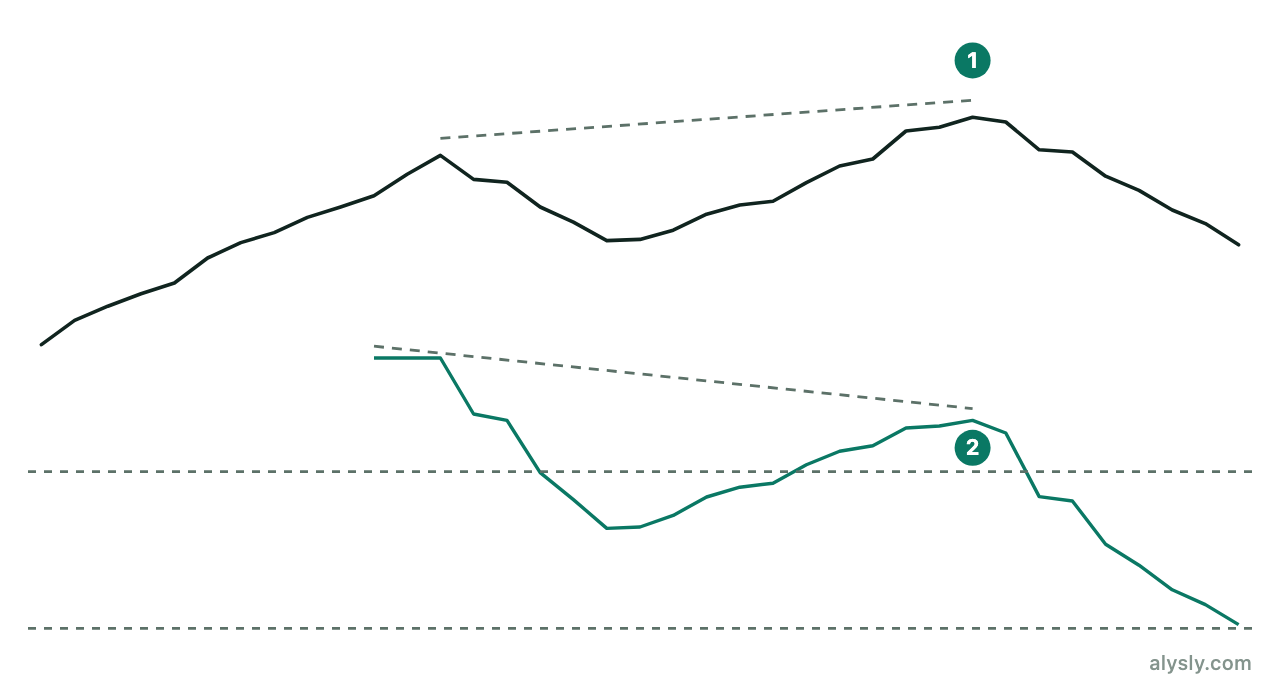
Oscillators: RSI and StochasticsRSI, stochastics, divergences – and the overbought misconception.
-
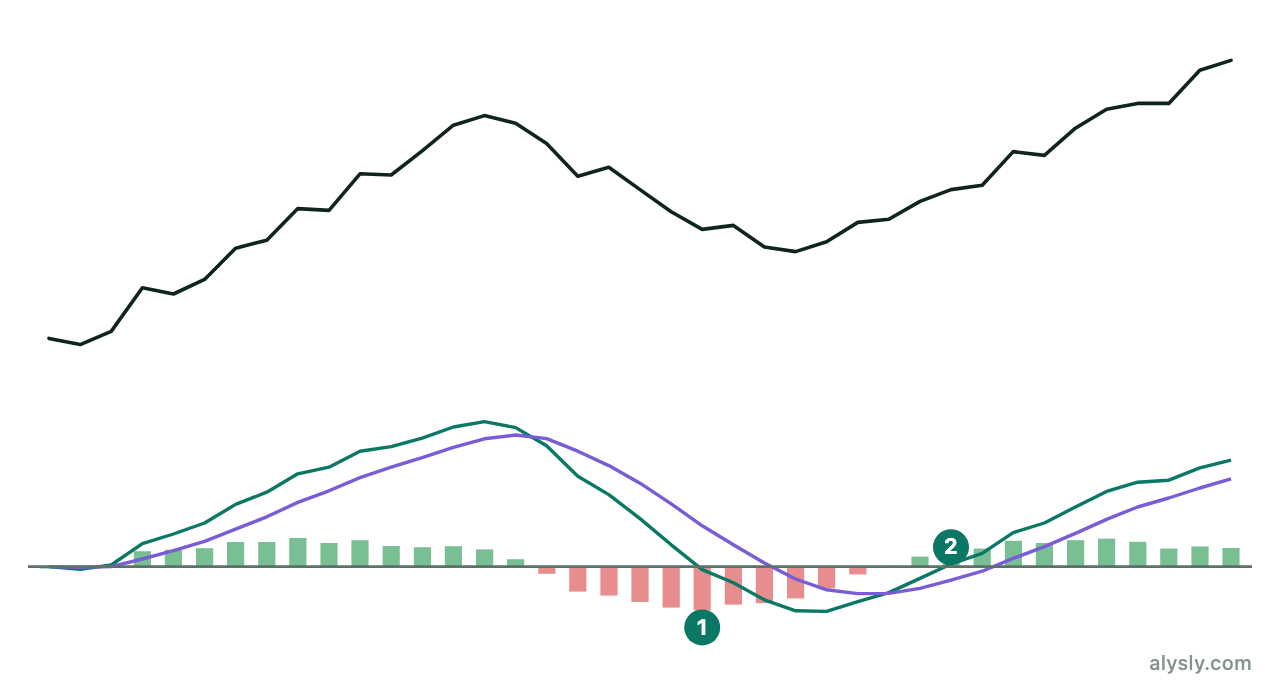
MACD and Trend StrengthMACD, signal line, histogram – and ADX as strength without direction.
-
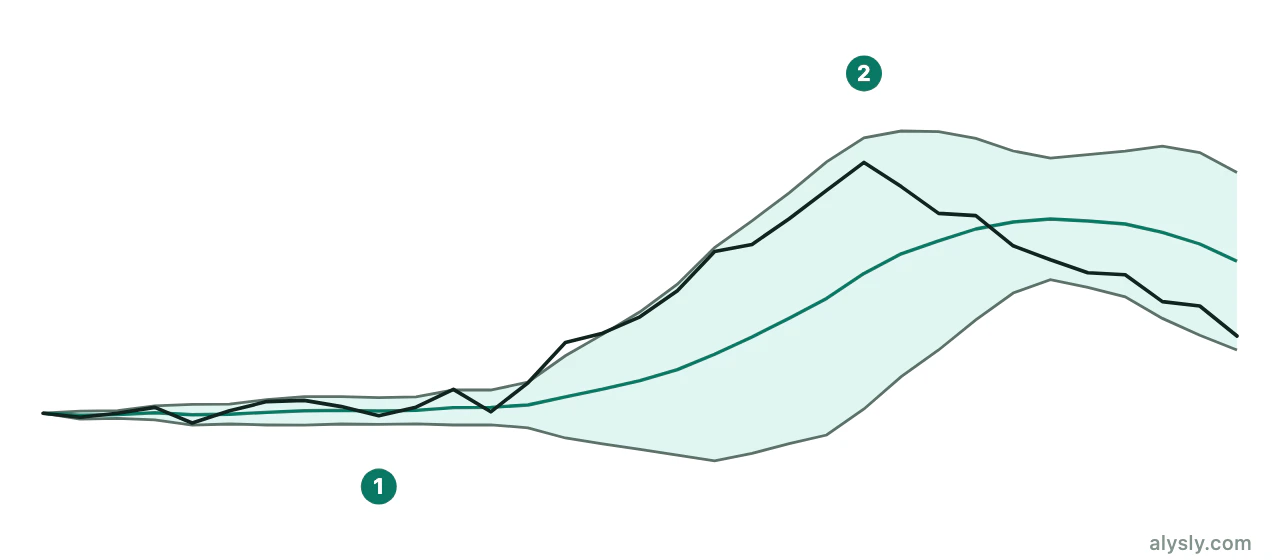
Measuring Volatility: Bollinger and ATRBollinger, ATR, squeeze – volatility drives stops, not direction.
-
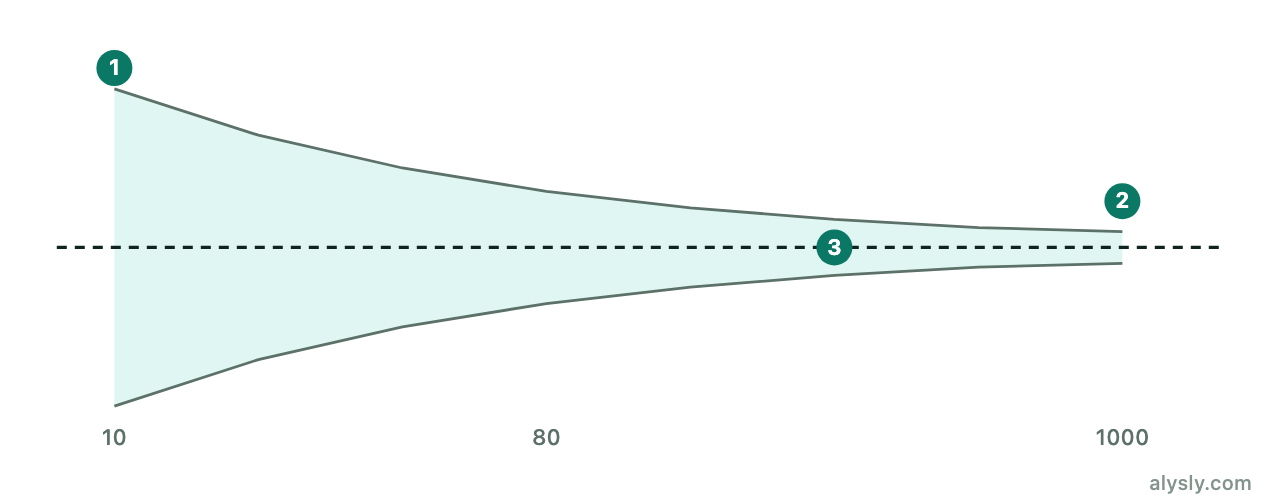
Testing a PatternFrom shape to testable rule – and the traps along the way.
-
Candlestick Reversal PatternsHammer, engulfing, star formations – construction, meaning, preconditions.
- Level 3
AI in trading
9 articles
Why standard machine learning fails on price series and what financial research developed instead: sampling, labels, leak-free cross-validation, and the question of how much a backtest proves at all.
-
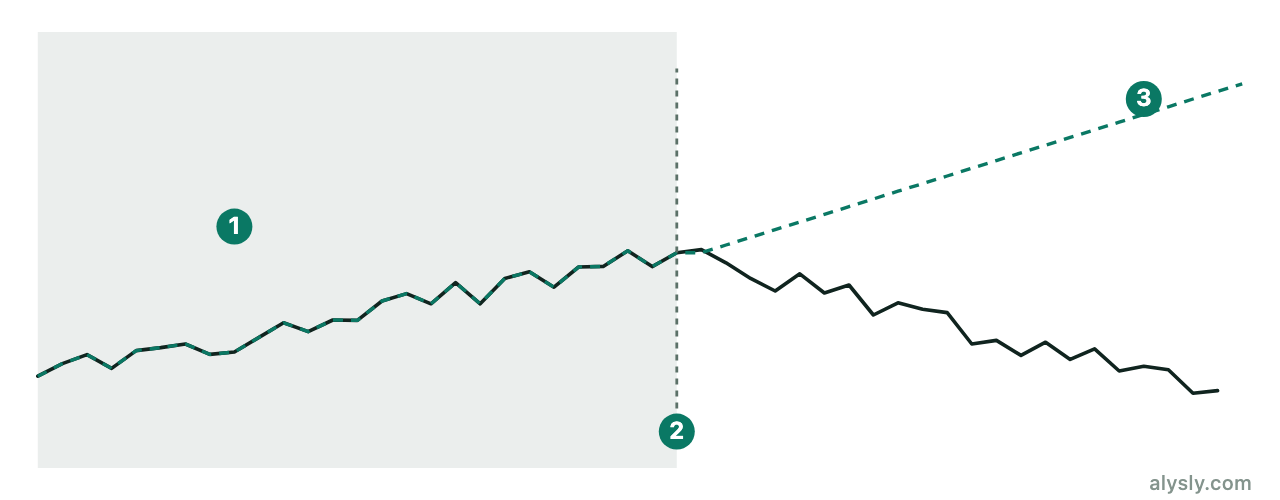
AI Trading: How It Works and Where It FailsFrom data to order: how AI trading works, and the hurdle it has to clear.
-
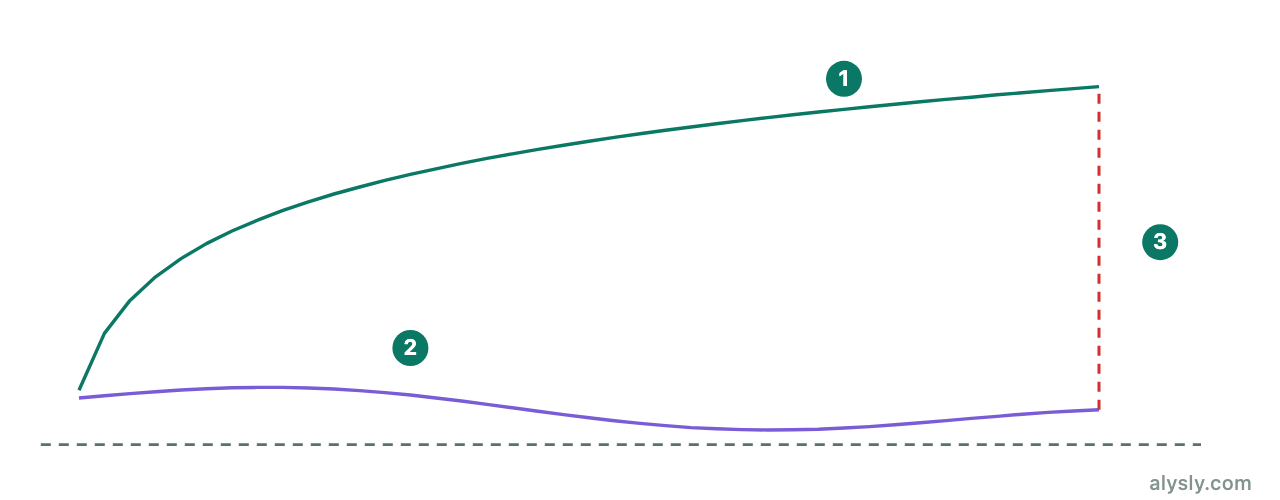
Why Machine Learning Fails in MarketsWhy standard methods break on price series – the list of failure modes.
-
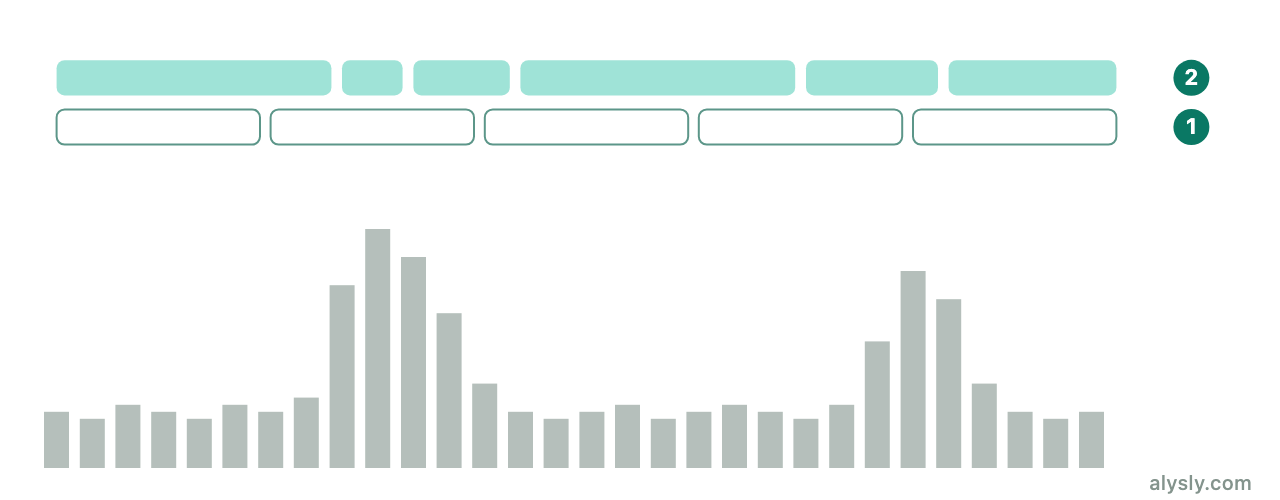
Data and Bars: The Sample DecidesTime bars are a poor sample – the alternatives and why.
-
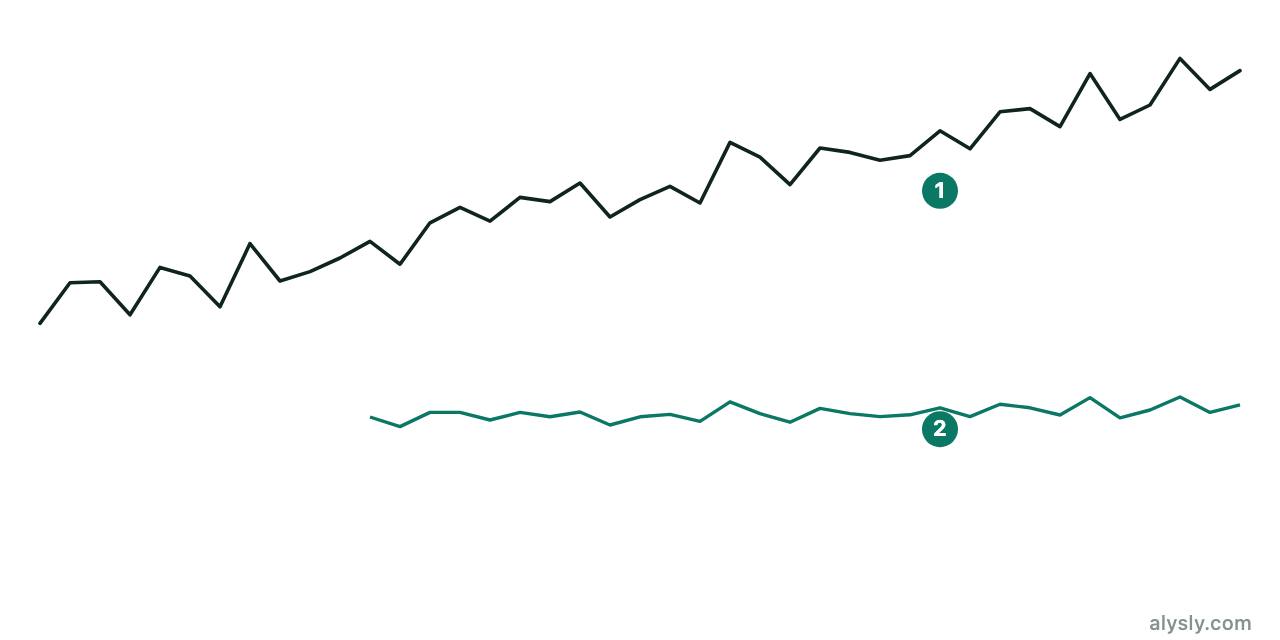
Stationarity and MemoryReturns erase memory – fractional differentiation does not.
-
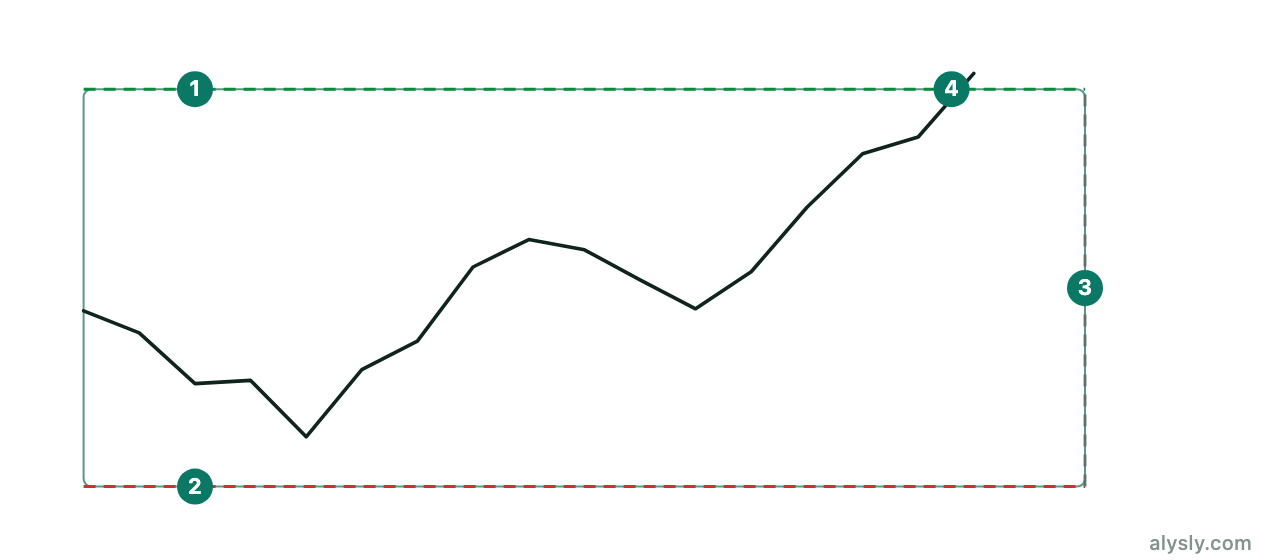
Labels: Triple Barrier and Meta-LabelingFixed horizons produce unusable labels – the triple barrier fixes that.
-
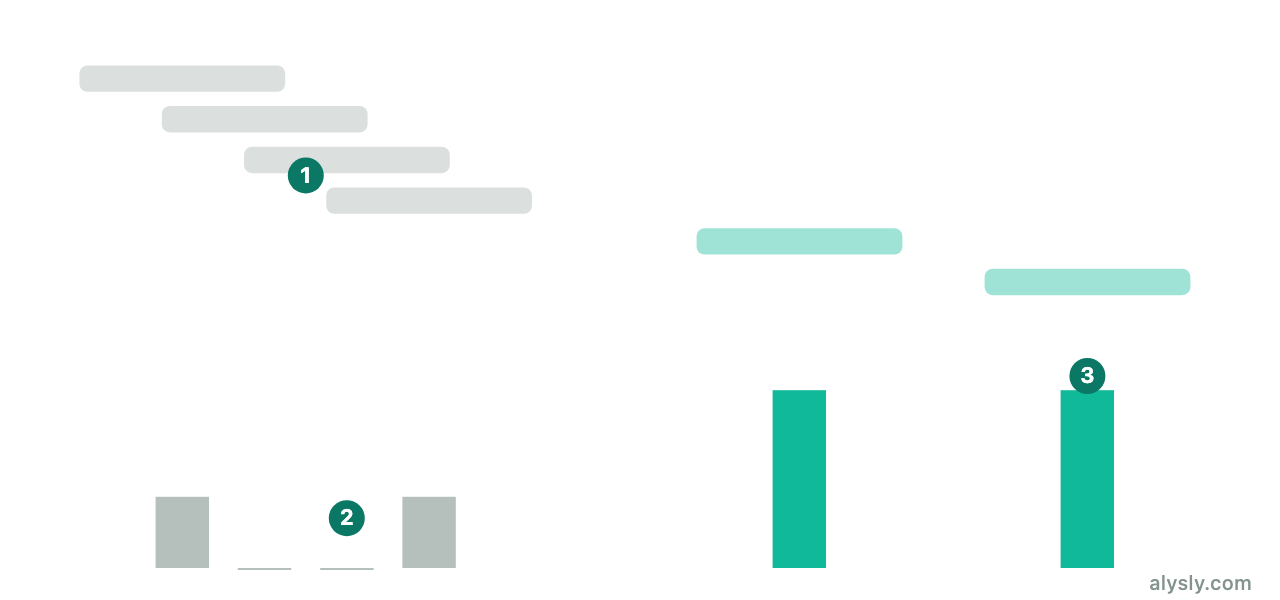
Overlapping Examples and Sample WeightsOverlapping labels fake independence – and how to correct for it.
-
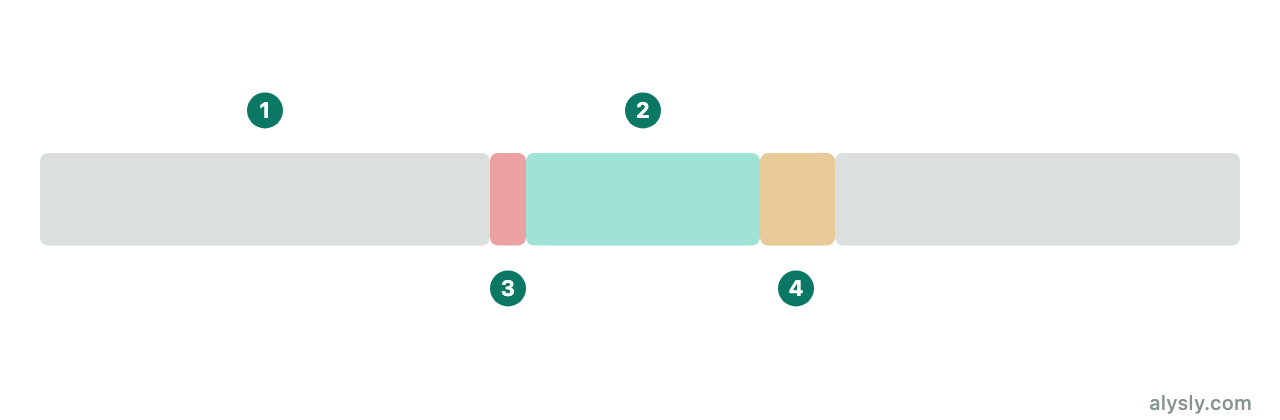
Cross-Validation Without LeakageWhy k-fold leaks on price data – purging, embargo, CPCV.
-
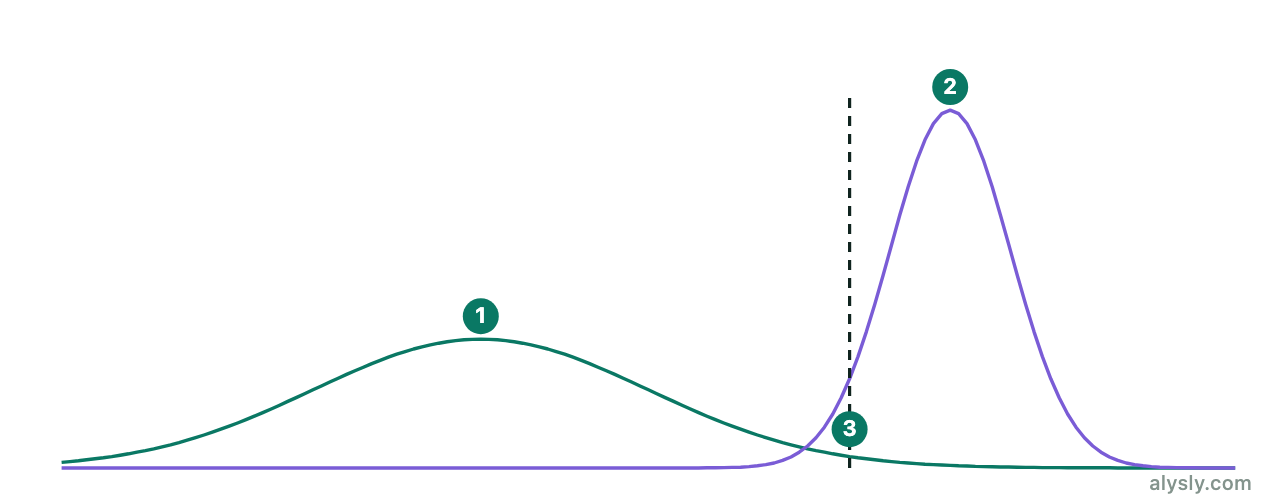
Backtest Overfitting: The Number of Trials CountsThe best of 50 trials always looks good – how to correct for it.
-
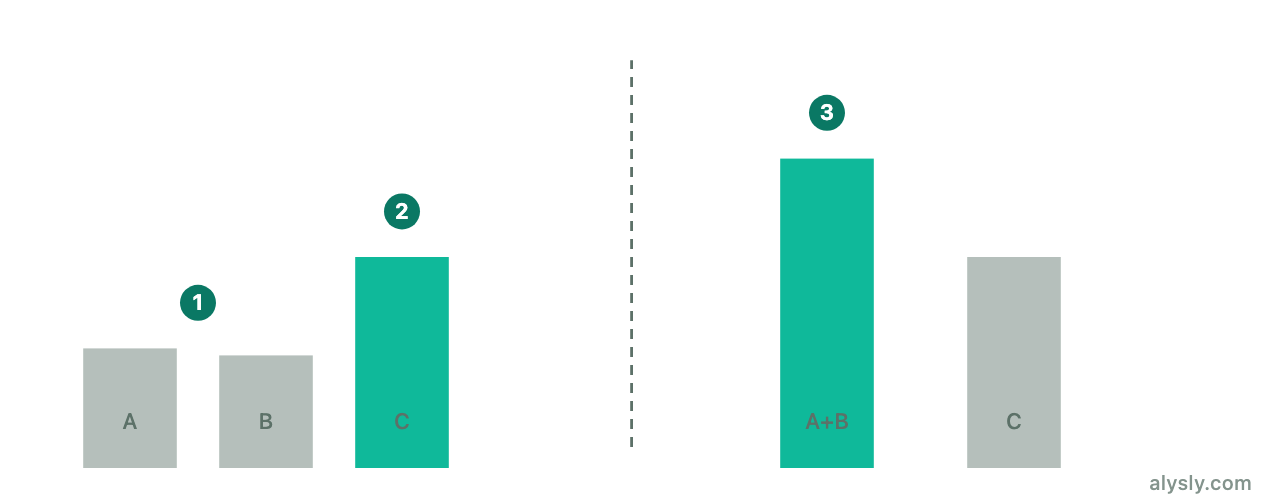
Feature Importance and Bet SizingWhich features actually carry the model – and how that becomes a position size.
-
AI Trading: How It Works and Where It FailsFrom data to order: how AI trading works, and the hurdle it has to clear.
Books to go deeper
Where an article stops, a book keeps going. The Books section sorts the standard works by topic rather than alphabetically: each entry says what prior knowledge it assumes, what it covers and where it has aged.

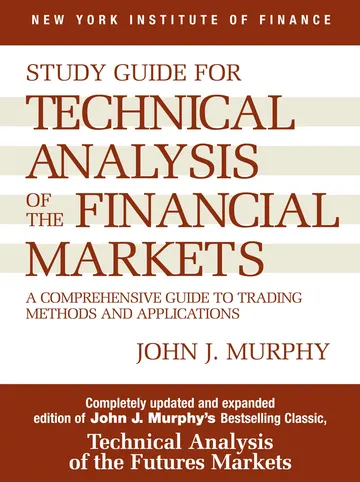
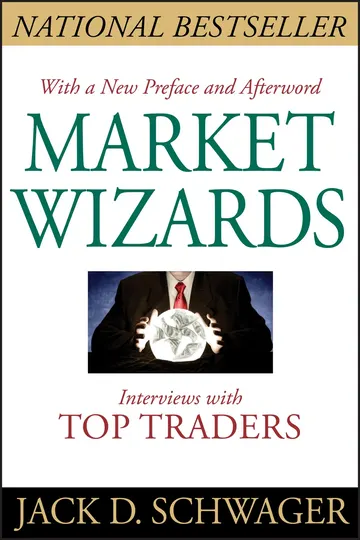
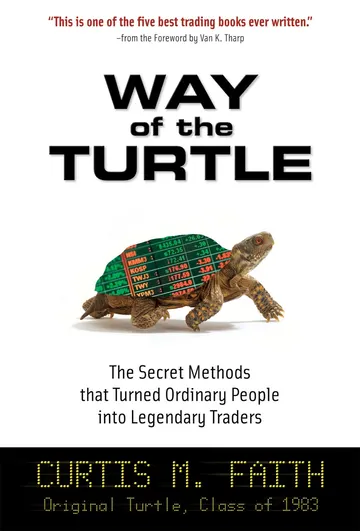 Trading & Technical Analysis
9 titles · 9 assessed · 2× Alysly Book Pick
Trading & Technical Analysis
9 titles · 9 assessed · 2× Alysly Book Pick
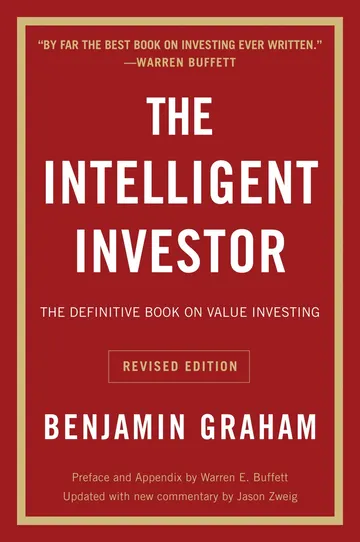
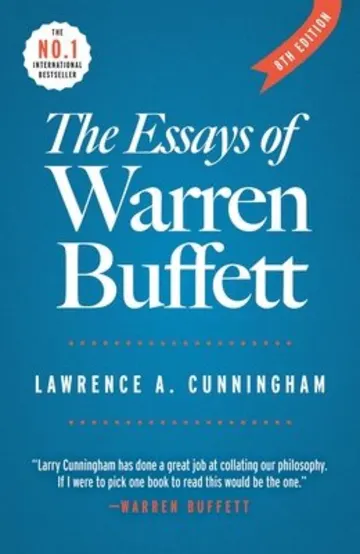

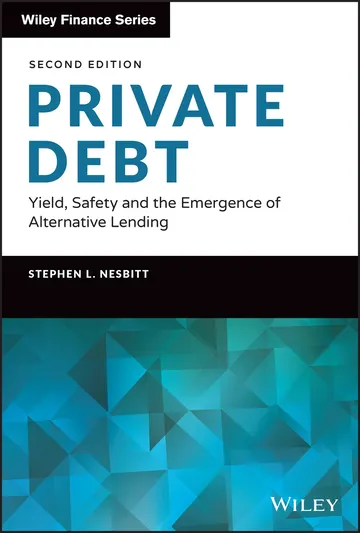 Investing & Portfolio
11 titles · 9 assessed · 1× Alysly Book Pick
Investing & Portfolio
11 titles · 9 assessed · 1× Alysly Book Pick
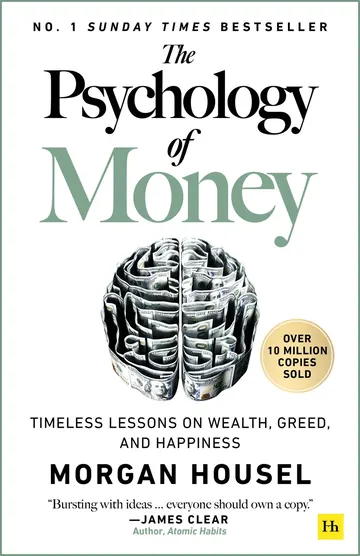

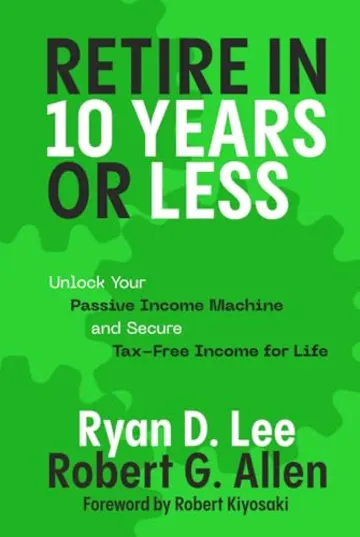
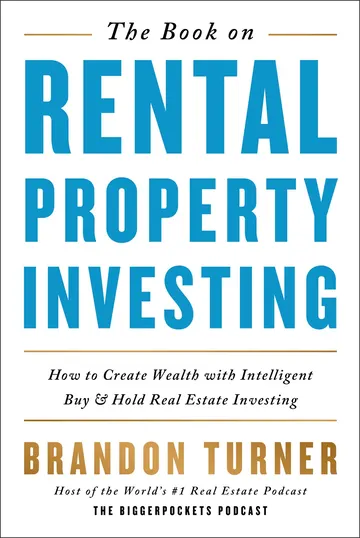 Money, Property & Retirement
9 titles · 9 assessed
Money, Property & Retirement
9 titles · 9 assessedEverything here is information, not investment or tax advice. All graphics are our own, drawn from synthetic price series — they show the shape of a pattern, not real market data.