What's Inside Your ETF Portfolio
Two ETFs with different names often hold the same companies. The look-through breaks a portfolio of several ETFs down to the individual stock and shows how large each position is across all funds combined.
How the Look-Through Works
It uses the funds’ published holdings lists, currently available for 95 of the 99 UCITS ETFs we cover. For each combination, the tool works in four steps:
- The portfolio weights entered are normalized to 100%.
- Each position in a fund gets an effective weight: weight in the fund × the fund’s share of the portfolio. NVIDIA at 5.39% in an MSCI World ETF that makes up 70% of the portfolio comes to 3.77%.
- When the same stock appears in several funds, the effective weights are added. Positions are matched on ticker and name together, because the same ticker can stand for different companies on different exchanges.
- Sectors and countries are summed the same way.
The concentration rating depends on the combined weight of the ten largest positions: below 25% is low, 25 to under 45% medium, 45% and above high. These thresholds are our own rough guide, not an industry standard.
Examples From the Holdings Lists
Holdings lists dated September 14 to 16, 2026:
| Portfolio | Largest position | Top 10 combined | US share | Holdings |
|---|---|---|---|---|
| 100% MSCI World (EUNL) | NVIDIA, 5.39% | 26.9% | 72.3% | 1,250 |
| 70% MSCI World, 30% MSCI EM IMI (IS3N) | TSMC, 4.00% | 23.4% | 50.6% | 4,202 |
| 50% MSCI World, 50% Nasdaq 100 (EXXT) | NVIDIA, 6.81% | 36.8% | 84.6% | 1,252 |
| 100% MSCI ACWI IMI (SPYI) | NVIDIA, 4.32% | 21.9% | 62.5% | 5,969 |
The third row shows a common pattern. Adding a Nasdaq 100 ETF to a world ETF brings almost no new companies into the portfolio, yet it raises the weight of large US tech stocks considerably. The ETF overlap calculator measures the overlap between two funds directly.
Limits
- Reporting date. Depending on the fund, holdings lists come out daily to monthly. Between two lists, price moves shift the weights.
- Only funds with holdings data. ETFs without a list are left out, and US-listed ETFs are not part of this tool.
- Names and countries from the holdings lists. Company names and countries are not written consistently across lists, so the same stock can occasionally appear in two rows.
- Cash and derivatives are included in some lists and not in others. The positions therefore do not always add up to exactly 100%.
A link with the chosen weights can be copied and reused in the portfolio tool . The overview of ETF holdings by stock shows which funds contain a particular company.
More calculators and tools are listed in the tools overview.
Latest Investment Analysis
 · Mixed
Weekly Analysis: MSCI China Leads the Week (+2.6%) · October 5–9, 2026
 · Mixed
Weekly Analysis: Nikkei 225 Sets the Tone for the Week (+3.4%) · September 28 – October 2, 2026
 · Risk-on
Weekly Analysis: S&P 500 Information Technology Leads the Week (+3.5%) · September 21–25, 2026
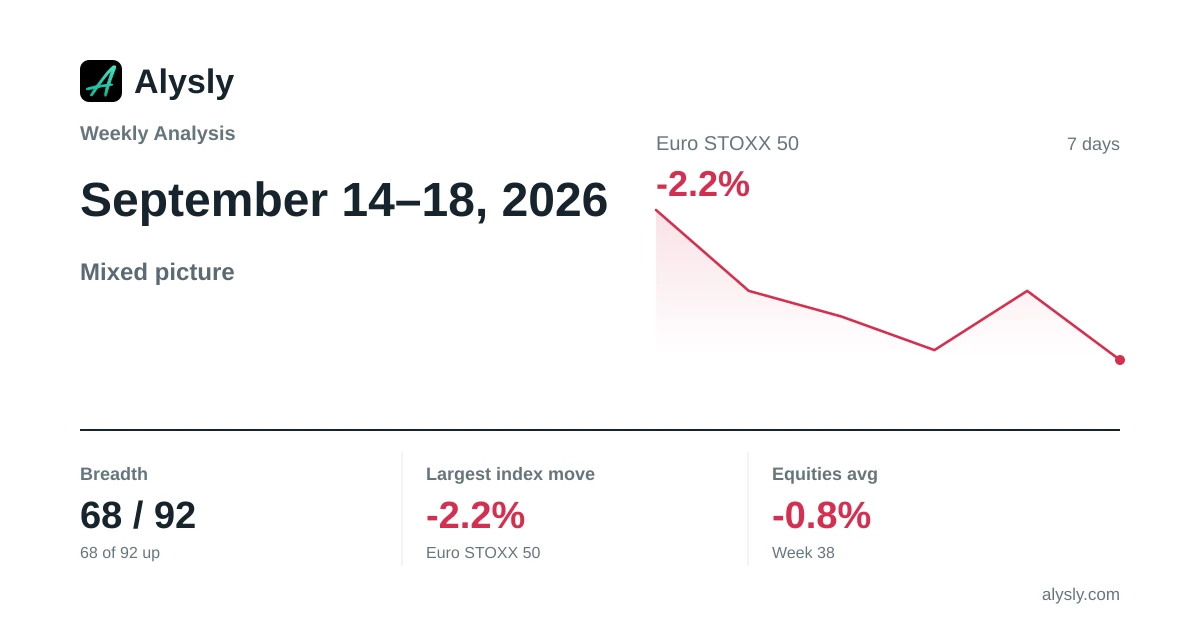 · Mixed
Weekly Analysis: Euro STOXX 50 Weighs on the Week (-2.2%) · September 14–18, 2026
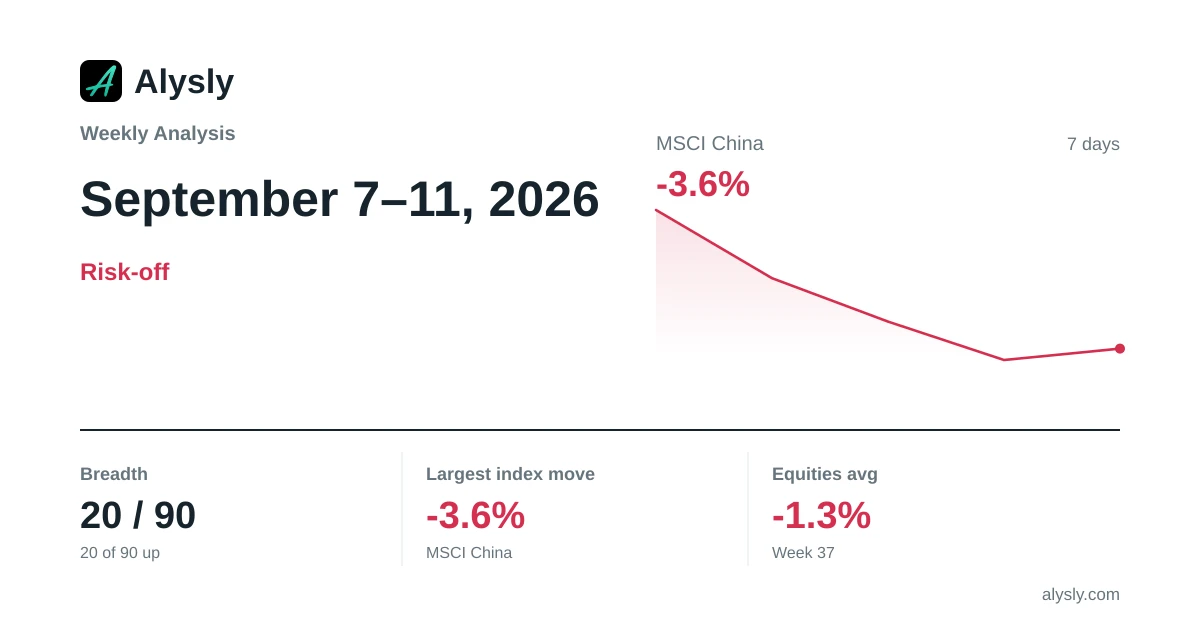 · Risk-off
Weekly Analysis: MSCI China Lags the Week (-3.6%) · September 7–11, 2026