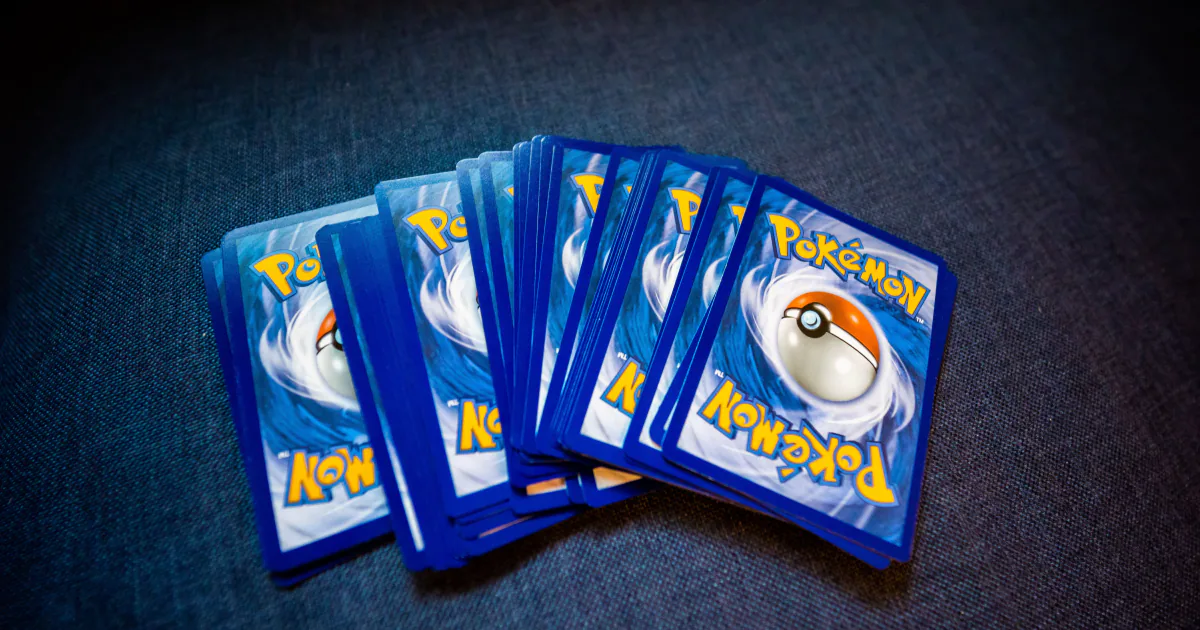
Pokémon Cards PSA 10 Investing: Wizards of the Coast Sets
Investing in Pokémon cards: the Wizards of the Coast sets (1999–2003) in PSA 10 — real sale prices, annual returns and a comparison with Bitcoin and gold.
Pokémon cards as an investment, compared with Bitcoin, stocks and gold. These pages cover 420 cards from 18 sets, based on 5,193 actual sales. Each set has its own page with price history, annual returns and comparisons with major asset classes.
Price Index for This Asset Class
Calculated from 2,506 price pairs for the same item across 420 cards. Not from medians: a quarterly median can consist of different items and therefore also reflects what happened to be offered for sale.
Base 100 at the first quarter. Method after Bailey/Muth/Nourse — the same one behind official property indices. It evaluates only price changes of the same standardized good; positions never sold a second time do not enter, frequently traded ones are overweighted.
Ranked by Return per Year
218 positions with at least 10 documented sales. Annual return from the first to the most recent period value; real = after inflation over the same period.
 Machamp #16 · Expedition (2002)
 Rapidash #26 · Expedition (2002)
 Starmie #H28 · Skyridge (2003)
 Steelix #H23 · Aquapolis (2003)
 Octillery #H20 · Aquapolis (2003)
 Zapdos #H32 · Aquapolis (2003)
 Alakazam #H1 · Skyridge (2003)
 Umbreon #13 · Neo Discovery Unlimited (2001)
 Dark Feraligatr #5 · Neo Destiny 1st Edition (2002)
 Giovanni's Persian #8 · Gym Challenge 1st Edition (2000)
 Gengar #5 · Fossil 1st Edition (1999)
 Hitmonlee #7 · Fossil 1st Edition (1999)
 Ho-oh #52 · Wizards Black Star Promos (2002)
 Gyarados #6 · Base Set Shadowless (1999)
 Arcanine #H2 · Skyridge (2003)
 Umbreon #H29 · Aquapolis (2003)
 Light Togetic #15 · Neo Destiny 1st Edition (2002)
 Raichu #H25 · Skyridge (2003)
 Umbreon #13 · Neo Discovery 1st Edition (2001)
 Blastoise #4 · Expedition (2002)
 Hypno #H12 · Aquapolis (2003)
 Cool Porygon #15 · Wizards Black Star Promos (2000)
 Poliwrath #H24 · Skyridge (2003)
 Kabutops #9 · Fossil 1st Edition (1999)
 Shining Tyranitar #113 · Neo Destiny 1st Edition (2002)
 Typhlosion #18 · Neo Genesis 1st Edition (2000)
 Politoed #H23 · Skyridge (2003)
 Flying Pikachu #25 · Wizards Black Star Promos (2000)
 Mewtwo #20 · Expedition (2002)
 Pichu #12 · Neo Genesis 1st Edition (2000)
 Dark Espeon #4 · Neo Destiny 1st Edition (2002)
 Shining Mewtwo #109 · Neo Destiny 1st Edition (2002)
 Machamp #H15 · Skyridge (2003)
 Snorlax #11 · Jungle 1st Edition (1999)
 Azumarill #2 · Neo Genesis 1st Edition (2000)
 Togetic #16 · Neo Genesis 1st Edition (2000)
 Delibird #5 · Neo Revelation 1st Edition (2001)
 Crystal Ho-oh #149 · Skyridge (2003)
 Electrode #H7 · Aquapolis (2003)
 Jolteon #H12 · Skyridge (2003)
 Kabutops #H13 · Skyridge (2003)
 Misty's Gyarados #13 · Gym Challenge 1st Edition (2000)
 Steelix #H29 · Skyridge (2003)
 Giovanni's Nidoking #7 · Gym Challenge 1st Edition (2000)
 Blissey #H6 · Aquapolis (2003)
 Lt. Surge's Raichu #11 · Gym Challenge 1st Edition (2000)
 Scizor #H21 · Aquapolis (2003)
 Zapdos #16 · Base Set Shadowless (1999)
For context: the median across all 218 covered positions is +64.4% a year. “Gap” is the typical time between two sales — it tells you how long you may wait for a buyer. Returns are gross price changes: premium, commission, grading and storage costs are not deducted.
PSA 10 Pokémon Trading Cards vs. the Markets
Real auction prices of PSA 10 cards compared with the S&P 500, MSCI World, Bitcoin and gold. All series are indexed to 100 as of July 11, 2024, and shown on a logarithmic scale.
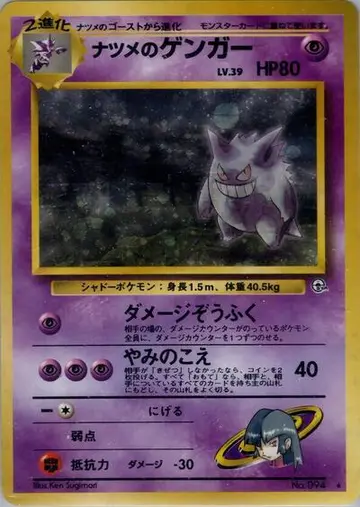 PSA 10 Pokémon Sabrina's Gengar #94Japanese Gym 2 (1999)
History and sales
Sabrina's Gengar #94 +1,913.0% S&P 500 +27.0% MSCI World +37.0% Bitcoin +46.0% Gold +56.0%
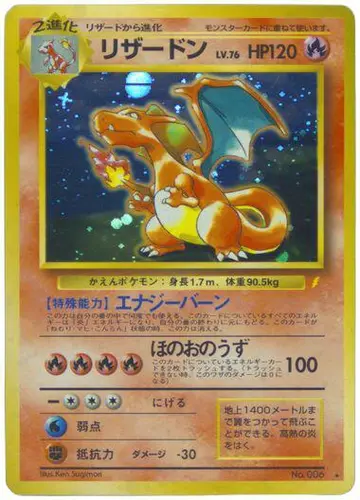 PSA 10 Pokémon Charizard #6Japanese CD Promo (1999)
History and sales
Charizard #6 +500.0% S&P 500 +27.0% MSCI World +37.0% Bitcoin +46.0% Gold +56.0%
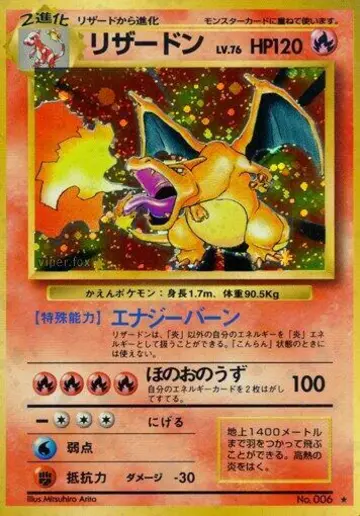 PSA 10 Pokémon Charizard #6Japanese Base Set (1996)
History and sales
Charizard #6 +469.0% S&P 500 +27.0% MSCI World +37.0% Bitcoin +46.0% Gold +56.0%
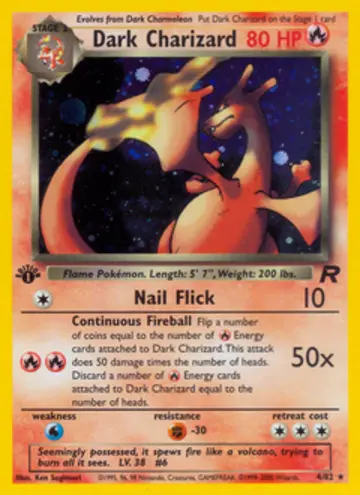 PSA 10 Pokémon Dark Charizard #4Team Rocket 1st Edition (2000)
History and sales
Dark Charizard #4 +85.0% S&P 500 +27.0% MSCI World +37.0% Bitcoin +46.0% Gold +56.0%
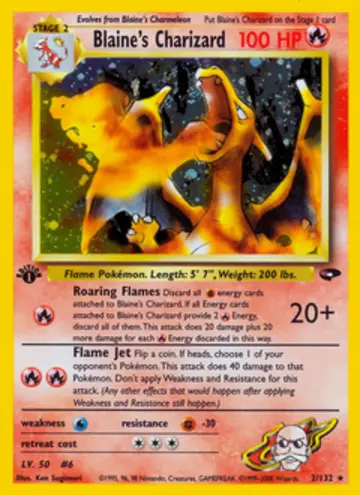 PSA 10 Pokémon Blaine's Charizard #2Gym Challenge 1st Edition (2000)
History and sales
Blaine's Charizard #2 +69.0% S&P 500 +27.0% MSCI World +37.0% Bitcoin +46.0% Gold +56.0%
Period Jul 11, 2024 to Sep 28, 2026. Positions are picked by the number of recorded sales, not by return. Prices are hammer prices including the buyer's premium; seller's commission, taxes and holding costs are not deducted. All cards in detail
Sets
 Base Set
1999
44 positions · 753 sales
 Jungle
1999
28 positions · 286 sales
 Fossil
1999
21 positions · 323 sales
 Wizards Black Star Promos
1999
42 positions · 586 sales
 Base Set 2
2000
8 positions · 46 sales
-
Team Rocket
2000
27 positions · 365 sales
 Gym Heroes
2000
23 positions · 217 sales
-
Gym Challenge
2000
32 positions · 369 sales
 Neo Genesis
2000
17 positions · 170 sales
 Neo Discovery
2001
19 positions · 165 sales
 Neo Revelation
2001
16 positions · 145 sales
 Southern Islands
2001
13 positions · 116 sales
 Legendary Collection
2002
6 positions · 49 sales
 Expedition
2002
15 positions · 135 sales
 Neo Destiny
2002
37 positions · 467 sales
 Aquapolis
2003
30 positions · 264 sales
 Skyridge
2003
38 positions · 515 sales
-
Japanese editions
1996
4 positions · 222 sales