All ETFs at a glance – filterable by provider, cost (TER), fund size and replication method.
Alysly Data Analysis: ETFs
Common Portfolio Designs, Backtested on Our Own Fund Series
Each of these portfolios is made up of funds we also carry in our database. The calculation is based on their daily net asset values and includes fund costs. It therefore shows how a portfolio of exactly these funds would have performed – not based on index data, which leaves fund costs out.
Compared From Oct 13, 2017
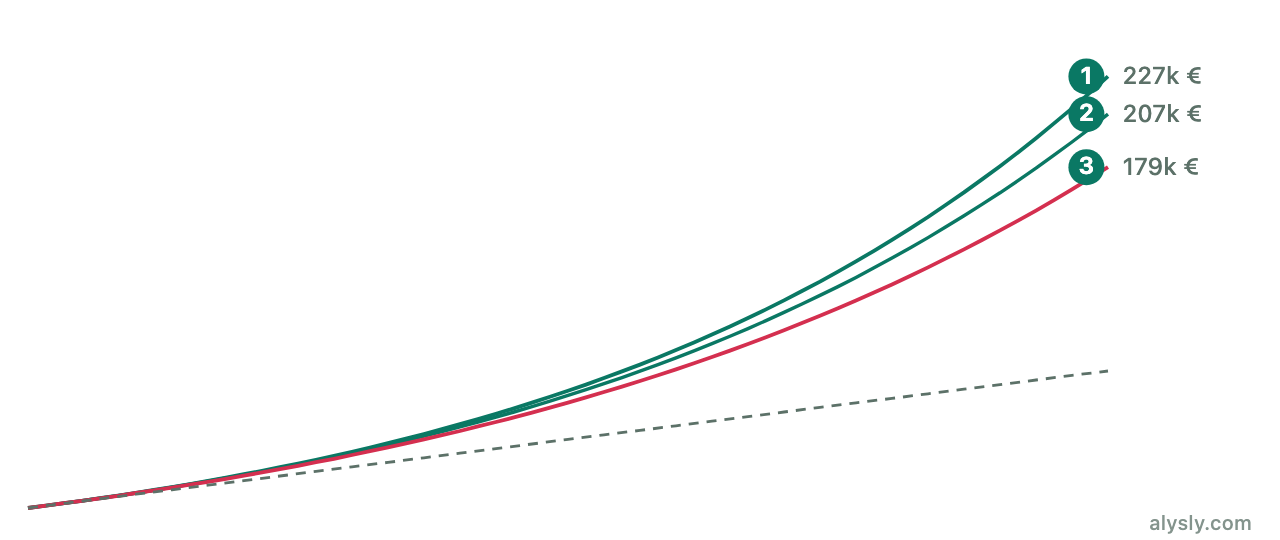
All lines are set to 100 on the shared starting day. Oct 13, 2017 is the earliest possible shared start, because the data series of the youngest building block across all portfolios begins on that day. An earlier start would therefore not be possible for every portfolio.
Here each portfolio counts from its own first day, which is stated with it. The returns on these cards are therefore not comparable with one another; the table above is for that.
One ETF for Everything
MSCI ACWI IMI
100.0% MSCI ACWI IMI
(SPYI)
Developed markets, emerging markets and small caps in a single fund – the shortest form of a global portfolio.
fromMay 16, 2011
Total343.9%
Per year10.16%
Deepest fall-34.7%
Cost (TER)0.17%
70/30 World and Emerging Markets
MSCI World + MSCI Emerging Markets
70.0% MSCI World
(EUNL)
30.0% MSCI Emerging Markets
(SPYM)
The classic: emerging markets weighted above their market value, closer to their share of the world economy.
fromMay 16, 2011
Total290.3%
Per year9.24%
Deepest fall-33.6%
Cost (TER)0.19%
Rebalanced to target weights once a year. Letting it run would have produced 9.53% per year – 0.29 points more.
60/40 World and Emerging Markets
MSCI World + MSCI Emerging Markets
60.0% MSCI World
(EUNL)
40.0% MSCI Emerging Markets
(SPYM)
The same two funds, with emerging markets weighted higher still.
fromMay 16, 2011
Total260.0%
Per year8.67%
Deepest fall-33.6%
Cost (TER)0.19%
Rebalanced to target weights once a year. Letting it run would have produced 9.02% per year – 0.35 points more.
50/30/20 With Europe
MSCI World + MSCI Emerging Markets + MSCI Europe
50.0% MSCI World
(EUNL)
30.0% MSCI Emerging Markets
(SPYM)
20.0% MSCI Europe
(XMEU)
Europe on top, against the roughly 70 percent US weight in the world index.
fromMay 16, 2011
Total244.0%
Per year8.35%
Deepest fall-34.0%
Cost (TER)0.15%
Rebalanced to target weights once a year. Letting it run would have produced 8.65% per year – 0.30 points more.
70/30 With Small Caps
MSCI World + MSCI World Small Cap
70.0% MSCI World
(EUNL)
30.0% MSCI World Small Cap
(ZPRS)
Developed-market small companies, which the MSCI World leaves out.
fromNov 25, 2013
Total251.6%
Per year10.26%
Deepest fall-36.0%
Cost (TER)0.28%
Rebalanced to target weights once a year. Letting it run would have produced 10.32% per year – 0.06 points more.
Sustainable 70/30
MSCI World SRI + MSCI EM SRI
70.0% MSCI World SRI
(2B7K, EUR)
30.0% MSCI EM SRI
(SUSM)
The same split, but only the best-rated companies within each sector, so far fewer holdings.
fromOct 13, 2017
Total139.9%
Per year10.23%
Deepest fall-33.3%
Cost (TER)0.22%
Rebalanced to target weights once a year. Letting it run would have produced 10.29% per year – 0.06 points more.
Multi-Factor, Five Times 20
Small cap + value + momentum + quality + EM IMI
20.0% MSCI World Small Cap
(ZPRS)
20.0% MSCI World Value
(IS3S)
20.0% MSCI World Momentum
(XDEM)
20.0% MSCI World Quality
(IS3Q)
20.0% MSCI EM IMI
(IS3N)
Five equal building blocks, none of them the world index itself.
fromOct 3, 2014
Total227.5%
Per year10.38%
Deepest fall-34.6%
Cost (TER)0.23%
Rebalanced to target weights once a year. Letting it run would have produced 10.41% per year – 0.03 points more.
Dividend 70/30
S&P Global + Emerging Markets Dividend Aristocrats
70.0% S&P Global Dividend Aristocrats
(ZPRG)
30.0% S&P EM Dividend Aristocrats
(SPYV)
Companies with a long payout record, weighted by dividend yield rather than market value.
For this portfolio we show no performance of our own. Both funds pay their income out and the net-asset-value series does not contain it. Measured against the published returns it is short by 4.7 percentage points a year. Putting such a series next to series that do contain the income would make the dividend portfolio look worse than it was.
Published returns of the two funds, percent per year
% per year
1 yr
3 yr
5 yr
10 yr
ZPRG
10.65
15.08
6.88
6.06
SPYV
8.12
15.30
7.35
6.05
Returns per year as the fund company publishes them; as of Sep 30, 2026. Combining the two into one portfolio figure would be an estimate, and we do not do that. Once the payouts exist as a data series, this will carry the same chart as the others.
What These Numbers Leave Out
Taxes and account costs: Taxes, trading costs and account fees are not included. After these costs, the actual return is correspondingly lower.
Currency effects: The calculation is in US dollars. Euro share classes are converted at the ECB reference rate of the day. In euros, the results can therefore look different – because of exchange-rate moves, not because of different performance.
Only the past: The longest series begins on May 16, 2011. It therefore covers certain market phases, but not every possible market condition. No statement about future performance can be derived from it.
Checked data: Every fund series is reconciled against the published returns and matches them to within 0.01 percentage points a year. Where a series does not reach this accuracy, we say so.