Level 0 ETF basics · Part 6/14
Savings plan or lump sum: what historical data shows
A larger sum can be invested in two ways: all at once, or spread over several months via a savings plan.
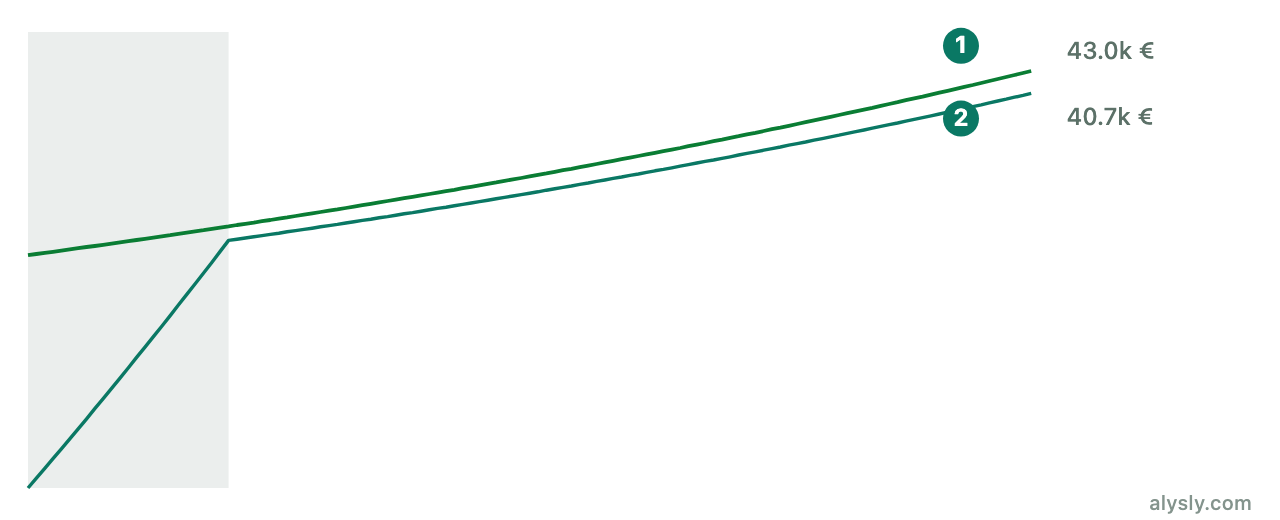
- Lump sum: in historical comparisons it came out ahead on average, because stock markets rose more often than they fell over long periods. The spread-out money was invested for less time.
- Spreading it out (cost averaging): it reduces the risk of investing the entire sum right before a decline. It narrows the range of outcomes but does not raise the expected return.
Both can be compared with your own figures in the savings-plan calculator : a monthly rate over a period against a one-off starting amount.
In context
Historical averages say nothing about which route does better in an individual case. Which one fits depends on how a possible decline right after investing could be absorbed.
Information only, not investment advice.