Study · Collectibles · As of 4 September 2026
Is the Pokémon Card Market a Bubble? 4,159 Sales Say Maybe
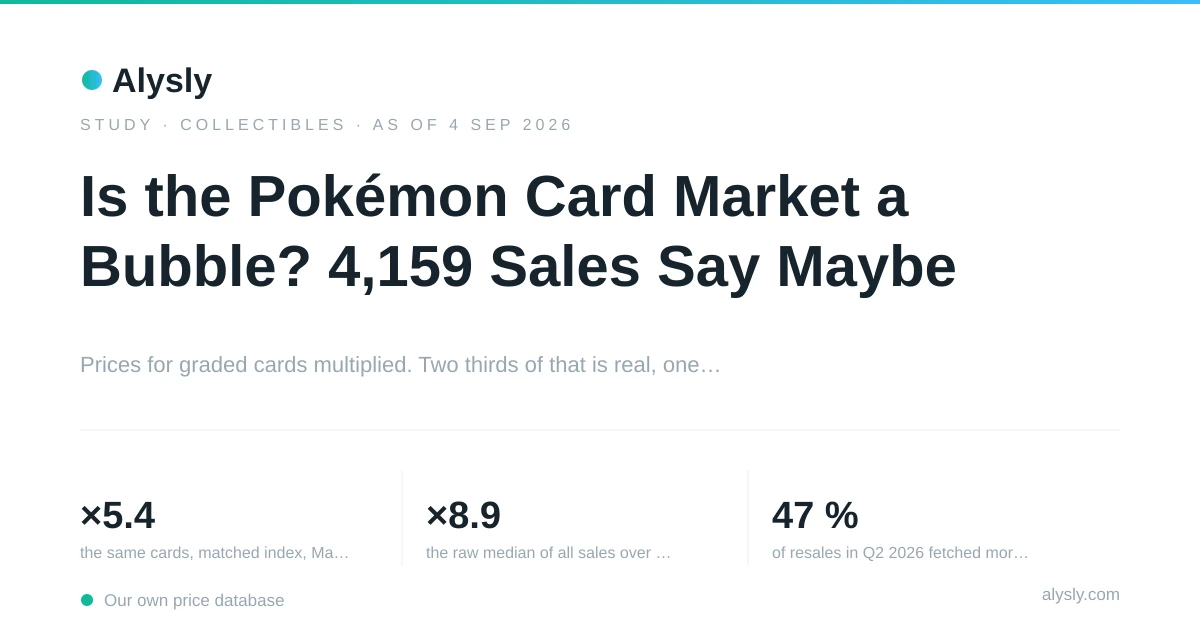
Between March 2022 and August 2026 the price of a PSA 10 card multiplied. By how much depends entirely on how you count — and the difference between the two answers is the most useful thing in this study.
- ×5.4the same cards, matched index, Mar 2022 – Aug 2026
- ×8.9the raw median of all sales over the same period
- 47 %of resales in Q2 2026 fetched more than double the previous price
- 43 %of resales in Q3 2026 came in below the previous price
Two answers to one question
Take every Pokémon card in our catalogue, take every auction price actually paid for one in grade PSA 10, and ask a simple question: how much more expensive did these cards get between March 2022 and August 2026?
The first answer is easy to produce and wrong. Line up all 4,159 sales by quarter, take the median of each quarter, and the series runs from 528 dollars to 4,680 — a factor of 8.9. It is the number a marketplace screenshot would give you, and it says less about prices than about which cards happened to cross the block.
The second answer only counts price changes of the same card between two of its own sales. That removes the question of what was on offer, because whatever changed between one sale of a card and the next is the market, not the selection. On that basis the index runs from 100 to 538, a factor of 5.4.
Loading figure …
Both lines describe the same market, and they disagree by a factor of 1.7. Roughly a third of the apparent boom is simply that more expensive cards came up for sale in later quarters than in early ones.
The matched line is the one to trust, and it has been checked twice. An independently calculated, equally weighted average of the price change per card lands at 450 index points rather than 538 — the same order of magnitude from a completely different calculation. Dropping the 42 most heavily traded cards, which the method automatically weights more strongly, leaves the index at 548. Neither control moves the picture.
What the shape actually looks like
Reduced to the matched index, the four and a half years fall into two entirely different periods.
For the first three of them, nothing happened. The index stood at 100 in March 2022 and at 94 in December 2024 — three years in which graded cards lost value, with a low of 80 in early 2024. Anyone who bought in 2022 and sold in 2024 lost money on the average card.
Everything the market is now famous for happened in the six quarters after that. From 94 in December 2024 the index went to 116, then 153, 185, 265, 456 by March 2026 and 551 by the end of June. That is a rise of 486 % in eighteen months, in a market that had gone nowhere for the three years before it.
Then, in the incomplete quarter that follows, the index slips to 538.
Which bubble markers the data meets
“Bubble” is a word that gets used for any price that rises quickly. It is more useful as a checklist, and three of its entries can be measured directly from resale pairs.
Loading figure …
Acceleration. The median resale gain rises from 3.9 % in the fourth quarter of 2024 to 33 % in the first quarter of 2025, then 37 %, 42 %, 63 % and 96 % by the first quarter of 2026. Rising prices are ordinary. Rising rates of increase, quarter after quarter, are the pattern that describes a market feeding on itself.
Dispersion. The standard deviation of resale returns widens from 0.34 in early 2025 to 0.73 in the second quarter of 2026. Prices for identical, identically graded objects were drifting further apart. In a market with a firm idea of what things are worth, that number does not double.
Breadth of extreme outcomes. The share of resales that fetched more than double the previous price climbs from 6.7 % at the end of 2024 to 47.1 % in the second quarter of 2026. At the peak, one resale in two doubled.
The fourth marker is the one that separates a boom from a bubble, and it can only be observed after the fact: whether the rise depends on new money rather than use. That is not in our data, and this study does not claim to settle it.
The top end ran fastest
A classic feature of speculative phases is that the most expensive objects rise more than the cheap ones, because the buying is about the object as an asset rather than as a thing to own. That is testable here by splitting the cards into three groups by the price at their first recorded sale — not their current price, which would let the outcome define the groups — and building a separate index for each.
Loading figure …
The cheap third, cards from 35 to 420 dollars at their first sale, reached 388. The middle third, 432 to 1,140 dollars, reached 602. The expensive third, above 1,170 dollars, reached 645. The gap is real but modest: expensive cards outran cheap ones by roughly two thirds, not by an order of magnitude. Read strictly, the boom is broad rather than concentrated at the top — which is an argument against the most extreme reading of the bubble thesis.
How this compares with everything else
A five-fold rise means little without a yardstick. Each row below compares the card index with another asset over exactly the same window, which matters because our series do not all start in 2022.
Loading figure …
| Asset | Period | Asset p.a. | Cards p.a. |
|---|---|---|---|
| S&P 500 | Mar 2022 – Aug 2026 | +12.6 % | +46.3 % |
| Gold | Jan 2023 – Aug 2026 | +27.9 % | +63.1 % |
| Bitcoin | Jul 2024 – Aug 2026 | +15.4 % | +143.1 % |
| US residential property | Apr 2022 – Jun 2026 | +2.7 % | +45.0 % |
Since July 2024, cards returned 143 % a year while Bitcoin — the asset usually held up as the speculative benchmark — returned 15 %. There is no window in this data in which graded cards were the calmer choice.
What the last quarter shows, and what it does not
The most recent index value is lower than the one before it: 538 against 551. In the same quarter the median resale gain collapses from 91 % to 2.3 %, and the share of resales below the previous price jumps from 14.6 % to 42.8 % — the highest since 2024, when the market was falling.
That is a clear change of direction in the data we have. It is also a quarter that is not finished: it ends with the last sale on 28 August rather than 30 September, and it rests on 194 resale pairs. A quarter this size is enough to see that the acceleration has stopped. It is not enough to declare the top, and anyone who has watched a fast market knows that pauses and reversals look identical for a while.
So the honest summary is this. Graded card prices rose five-fold in four and a half years, with the entire move packed into the last six quarters. Three of four measurable bubble markers are clearly present: acceleration, widening dispersion, and an extreme share of doublings. The rise is broad rather than confined to trophy cards. And in the most recent, incomplete quarter, all three markers turn at once.
Whether that makes it a bubble depends on what happens next, which no dataset can supply. What the data does say is that a market where nearly half of all resales doubled the previous price, and where a third of the headline rise turns out to be a composition effect, is not a market in which the number on a screenshot means what it appears to mean.
Data and method
- Data basis
- 4,159 prices actually paid at auction across 420 cards, all in grade PSA 10, all in USD, from 28 Feb 2022 to 28 Aug 2026. Prices include the buyer’s premium.
- Method
- A matched-model index following Bailey/Muth/Nourse — the method behind Case-Shiller — applied to 2,165 resale pairs from 420 cards across 19 quarters. Only the price change of the SAME card between two sales enters it; the thinnest period rests on 40 pairs.
- Cross-check
- An independently calculated, equally weighted mean of the price change per card gives 450 index points instead of 538 — the same order of magnitude. The raw quarterly median stands at 886 and therefore overstates the move badly. Excluding the 42 most heavily traded cards leaves the index at 548.
- Only cards sold at least twice enter the index, and only pairs at least 30 days apart, in different quarters, with a price ratio below 20. Those filters come from the module the site already uses for its collectible pages, so this study and those pages report the same index.
- Cards that were never resold contribute nothing, and heavily traded cards carry more weight. Dropping the 42 most traded cards leaves the index at 548 instead of 538, so the result does not rest on them.
- Every price is a hammer price including the buyer’s premium, taken from the auction archive’s own lot data. Seller commission, grading, shipping, insurance and storage are not in it.
- All 4,159 sales come from a single auction archive. The index therefore measures one marketplace rather than the whole market, and private sales, dealer inventory and fixed-price listings are invisible to it. If that venue attracted a different mix of buyers over the period, the level of the index would move with it — which is one more reason the composition-adjusted line matters more than the raw one.
- The last quarter is incomplete: it ends with the most recent sale on 28 August 2026, not on 30 September. Its 194 resale pairs are enough to read a direction, not enough to call a turning point.
- Grade is held constant at PSA 10. Two PSA 10 copies of the same card are not the same physical object, but grading is what makes them interchangeable — which is the assumption the method needs.
Every figure comes from our own price database and is produced by a script in the repository. Running it again with the same cutoff date returns the same numbers. Not investment advice.