Study · ETFs · As of 4 September 2026
Is the MSCI World Too American? The Real Numbers
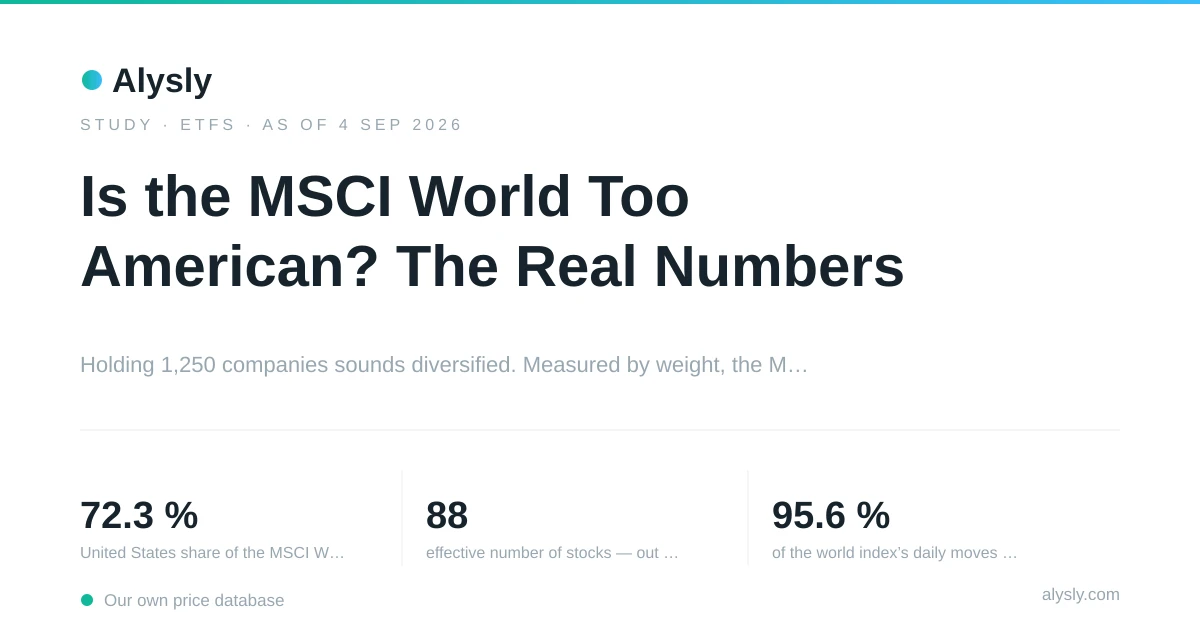
The MSCI World holds 1,250 companies from 23 countries, and roughly three quarters of its money sits in one of them. Whether that is a problem is usually argued with opinions. It can be settled with the fund’s own holdings, and the answer is more specific than either side of the argument tends to allow.
- 72.3 %United States share of the MSCI World
- 88effective number of stocks — out of 1,250 held
- 95.6 %of the world index’s daily moves explained by the S&P 500
- 27.0 %in the ten largest positions
Two ways to count a world index
A fund holding 1,250 companies across 23 countries sounds like the definition of diversification. Counting positions, though, is the least informative thing you can do with a portfolio, because a position of 0.01 % and a position of 5.7 % both count as one.
Counting by weight gives a different picture. In the largest MSCI World ETF, 72.3 % of the money sits in United States companies and 27.0 % in the ten largest positions. The single largest, NVIDIA, is 5.69 % of the whole fund — more than the entire weight of most member countries.
Loading figure …
The comparison across index families is where this becomes useful. The ACWI, which adds emerging markets, comes to 64.2 % United States. World Small Cap, often bought as a diversifier, is still 61.4 % American. And Emerging Markets, the index usually described as the risky one, has 37.0 % in its top ten and 15.1 % in Taiwan Semiconductor alone — a concentration well beyond anything in the World.
The number that describes it best
There is a single measure that turns weights into an intuitive figure: the effective number of stocks. It asks how many equally weighted positions would produce the concentration a portfolio actually has.
Loading figure …
For the MSCI World the answer is 88, from 1,250 holdings. The other 1,162 companies exist in the fund, but in terms of what moves the price, they are rounding. ACWI, with 2,245 holdings, comes to 107. World ex USA, with 738 holdings, comes to 230 — the least concentrated of the family precisely because the American mega caps are missing. World Small Cap, at 3,685 holdings, reaches 1,664, which is what genuine breadth looks like as a number.
So the fair statement is not that the MSCI World is undiversified. It is that its diversification is about a factor of fourteen weaker than its holdings count suggests, and that the gap comes almost entirely from one country’s largest companies.
What the concentration does in practice
Weights are a description. The question that matters is whether the index behaves like a world portfolio or like an American one, and daily returns answer it directly.
Over 524 shared trading days, the correlation between the world index and the S&P 500 is 0.978. The regression of one on the other gives a beta of 0.91 and an R² of 95.6 %: essentially all of the world index’s day-to-day movement is the US market, scaled slightly down. The correlation with developed markets outside the US is lower, at 0.859.
The returns say the same. Over that window the world index returned 49.1 %, the S&P 500 48.9 %, and developed markets outside the US 43.9 %. An investor who held the world index and an investor who held the S&P 500 had, for two years, the same experience with a difference of 0.2 percentage points.
That is the honest form of the concentration problem. It is not that the MSCI World will fall further than a US index in a crisis — it will fall slightly less. It is that buying it in the belief that you have bought the world buys you something that has been, in practice, an American index with a 28 % international tail.
How much a shock would actually cost
Mechanical arithmetic is worth doing here, because the intuition tends to overshoot in one direction and the reassurance in the other.
Loading figure …
If the ten largest positions fell 20 % while everything else stood still, the index would lose 5.4 %. If the entire US block fell 20 %, it would lose 14.5 %. At a 30 % fall in the US block the index loses 21.7 %, and at 50 % it loses 36.1 %.
The first number is the useful one for the “NVIDIA risk” argument: even a brutal repricing of the ten biggest names costs the index single digits. The second is the useful one for the concentration argument proper: a US-specific problem is transmitted almost fully, because there is not enough of anything else to absorb it.
Sector weights point the same way. Information technology alone accounts for 29.9 % of the fund, ahead of financials at 16.7 % and industrials at 11.0 %. The concentration is not only geographic.
So is the risk real?
Three findings, each measurable and each pointing in a different direction.
The claim that the MSCI World is barely diversified is wrong in its usual form. It holds 1,250 companies, and its effective breadth of 88 positions is greater than that of a US index (48) and vastly greater than that of Emerging Markets (30). Among the widely held indices, the World sits in the middle, not at the concentrated end.
The claim that it is a world portfolio is wrong too, and more clearly so. With 72.3 % in one country, 95.6 % of its daily movement explained by that country’s index, and a two-year return within 0.2 points of it, “world” describes the holdings list rather than the behaviour.
And the claim that a handful of technology companies could sink it is the weakest of the three: a 20 % fall across the top ten costs 5.4 %. What could sink it is a country, not a company.
What none of this can tell you is where the US share is going, or whether 72.3 % is high by historical standards. Our holdings data begins in July 2026 and describes a state, not a trend. That limit is worth more than a guess: the number in this study is exact, current, and says nothing whatsoever about next year.
Data and method
- Weights come from the published holdings of the largest ETF on each index in our own fund database, not from the index provider. An ETF replicates its index closely but not perfectly, so a weight here can differ from the official index by a few tenths of a percentage point.
- The country of a holding is the country field of the fund’s own holdings file. In the World ex USA fund it still shows 0.4 % United States, which is the size of the classification noise in this data.
- The effective number of stocks is 10,000 divided by the Herfindahl index of the weights. It answers the question: how many equally sized positions would produce this much concentration? It is a description of the weights, not a forecast.
- There is no history here. Our holdings data covers three snapshots between 12 July and 6 September 2026, so this study describes the index as it is today and cannot show how the US share developed. Any statement about a trend would be invented.
- The funds compared here were not all filed on the same day: four lists are dated 3 September 2026 and two 6 September. Across three trading days the weights move by hundredths of a point, far below the differences discussed, but the figures are not a single synchronised snapshot.
- Weights are normalised to the sum actually listed, which is between 99.7 % and 100 % per fund. The remainder is cash and futures positions the funds hold for liquidity.
- The daily-move comparison uses the world index ETF against the S&P 500 ETF over 524 shared trading days from 5 August 2024, which is as far back as those series go.
Every figure comes from our own price database and is produced by a script in the repository. Running it again with the same cutoff date returns the same numbers. Not investment advice.