Study · Wealth · As of 4 September 2026
Living Off Your Returns: What It Really Takes
Living off investment income is usually presented as a question of how much money you have. It is really a question of one number you cannot observe in advance: the real return, after inflation, over the decades you plan to spend. Everything else is arithmetic, and the arithmetic is unforgiving.
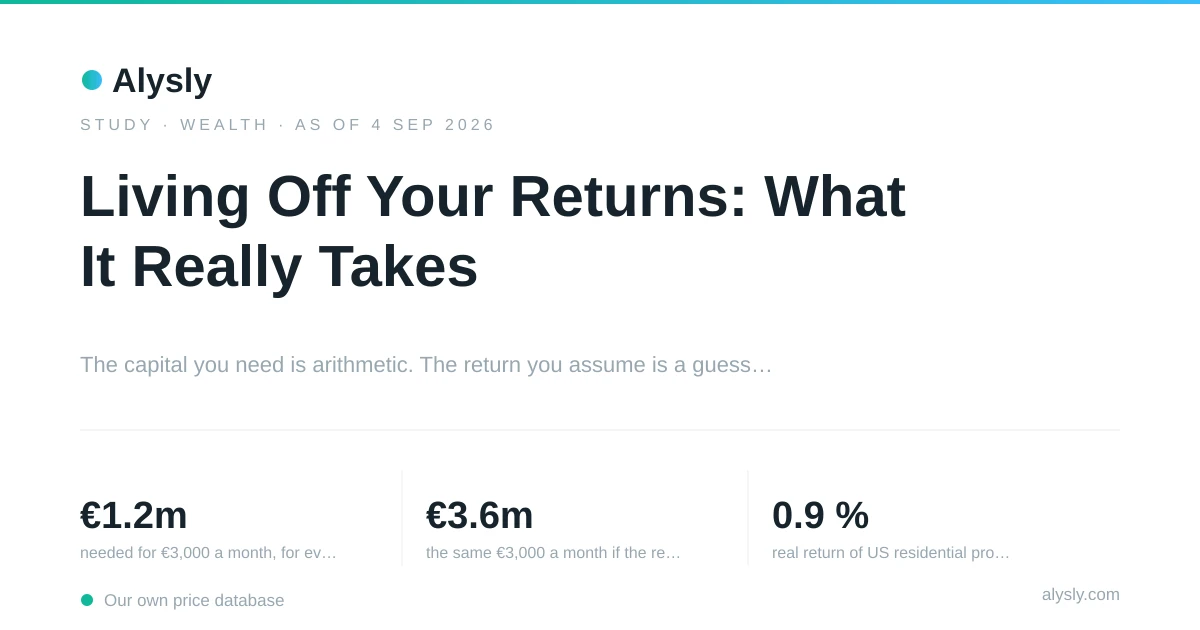
- €1.2mneeded for €3,000 a month, for ever, at a 3 % real return
- €3.6mthe same €3,000 a month if the real return is only 1 %
- 0.9 %real return of US residential property over 39 years
- 0 %capital left when the same returns arrive worst-months-first
The only number that matters
Ask what capital is needed to live off returns and the answer is a single division: the amount you want each year, divided by the real return you expect to earn. Everything difficult about the question hides in the second half of that sentence.
Loading figure …
For €3,000 a month — €36,000 a year — the capital required, for ever, is €1.2 million at a 3 % real return. At 4 % it falls to €900,000. At 2 % it rises to €1.8 million, and at 1 % to €3.6 million.
Allowing the capital to be consumed changes the picture completely, and it is the more realistic plan for most people. Over 30 years, the same €3,000 a month needs €705,600 at 3 % and €929,100 at 1 %. Over 40 years, €832,100 and €1.18 million.
The spread between those numbers is the whole problem. A single percentage point of assumed real return moves the requirement by a factor that no amount of saving discipline can compensate for. Which raises the obvious question: what real return is actually defensible?
What our own data says a real return looks like
Nominal returns are easy to quote and nearly useless for this purpose, because a withdrawal has to keep pace with prices. The relevant number is what is left after inflation, and it is much smaller than the headlines.
| Asset | Window | Nominal p.a. | Real p.a. |
|---|---|---|---|
| S&P 500 (price, no dividends) | 9.4 years | 13.4 % | 9.7 % |
| Gold | 3.7 years | 27.3 % | 23.1 % |
| US residential property | 39.4 years | 4.3 % | 0.9 % |
| German overnight deposits | 9.3 years | 0.2 % | −2.9 % |
Two of those rows are seductive and one is instructive. The equity and gold figures come from short, exceptional windows: nine years that contained one of the strongest bull markets on record, and under four years of a gold boom. Planning a forty-year retirement on a 9.7 % real return because the last nine years delivered it is the same error as planning on a lottery ticket that has already been drawn.
The property row is the one worth sitting with. It covers 39 years, from 1987 to 2026, and it is the longest continuous series we hold. Over that span, US residential property returned 4.3 % a year nominally and 0.9 % a year after inflation. That is what a long window does to a return that everybody describes as reliable.
Deposits are worse than they look. German overnight rates paid 1.76 % in total over 111 months, which is 0.19 % a year, while German consumer prices rose 3.16 % a year over the same window. The real return is −2.9 % a year: roughly a quarter of the purchasing power, gone without a single bad market day.
The order of returns decides as much as their size
Here the study can be exact, because no assumption is needed. Take our 114 monthly index returns, withdraw 4 % a year adjusted for inflation, and let the same returns arrive in different orders.
Loading figure …
In the order they actually occurred, the capital ends at 240 % of where it started. Reversed, at 250 %. With the best months first, at 304 %. With the worst months first, at zero: the account is exhausted before the good months arrive.
Nothing changed except the sequence. Same returns, same withdrawal, same length of time, and the outcome ranges from complete depletion to tripling. Randomly shuffled orders land between 228 % and 259 % nine times out of ten, which shows how unlikely the worst case is — and how little that helps the person it happens to.
This is why an average return is the wrong input for a withdrawal plan. An average describes the whole path; a retiree lives through one particular path, and the early years of it carry disproportionate weight.
Where this study has to stop
The obvious next step would be a failure rate: what share of retirements run out of money at a 4 % withdrawal. We can compute it from our own data, and the result demonstrates why it should not be believed.
Loading figure …
Drawing twelve-month blocks from our 114 monthly returns gives a failure rate of 0.3 % at 4 %, 1.1 % at 5 % and 4.9 % at 6 %. The median portfolio ends 30 years later at roughly 25 times its starting value.
Those numbers are arithmetically correct and practically worthless, and the reason is visible in the section above: the sample they are drawn from is nine years of one of the strongest equity markets in history, with 9.7 % real per year. A bootstrap can only resample the world it was given. Ours was never handed a lost decade, so it cannot produce one.
The honest conclusion is therefore not a failure rate but a rule for reading them: any withdrawal study is a statement about its sample period first and about withdrawals second. Ours would justify a 5 % withdrawal. A sample drawn from 1966 to 1982, or from Japan after 1990, would not, and we hold neither.
What the data does support
Three statements survive every caveat in this study.
The requirement is arithmetic, and it is steeper than it looks: €1.2 million for €3,000 a month at a 3 % real return, €3.6 million if the real return is 1 %. Whichever number you believe, the sensitivity to that assumption is larger than any plausible difference in saving rate.
Long windows produce small real returns. The only multi-decade series we hold delivered 0.9 % real over 39 years, against 9.7 % real for equities over nine. A plan built on the nine-year figure and a plan built on the 39-year figure differ by a factor of about three in required capital.
And sequence matters as much as size. The same returns, reordered, produced anything between a tripled portfolio and an empty one. That risk cannot be diversified away by choosing better investments; it is reduced by holding a buffer that lets you avoid selling into the bad years — which is, in the end, another way of saying that the capital required is higher than the division suggests.
Data and method
- Data basis
- es.f · 3 Apr 2017 to 4 Sep 2026 · 0 trading sessions
- The equity figures come from the front-month S&P 500 futures chain, 3 April 2017 to 4 September 2026 — a price series without dividends, in dollars. Dollar returns are deflated with the US CPI series in our own macro data (3.38 % a year), the German deposit rate with the German HICP series (3.16 % a year). Mixing the two would compare a return in one currency with the inflation of another.
- Inflation is the mean of the year-on-year rates over the window. Chaining the annual rates instead gives 3.45 % and a real equity return of 9.7 % rather than 9.8 %. The difference is smaller than the third digit of anything in this study, and both figures are shown so that nobody treats that digit as solid.
- The capital tables are exact arithmetic, not simulation: a perpetual withdrawal needs the annual amount divided by the real return; a 30- or 40-year withdrawal uses the corresponding annuity factor.
- The failure rates come from a bootstrap of our own 114 monthly index returns, drawn in twelve-month blocks so that good and bad years stay together, with withdrawals rising at the measured rate of inflation. They must be read with the caveat in the last section: this sample contains no lost decade.
- The sequence test is not a simulation at all. It uses the same 114 monthly returns in different orders, which is why it is the most reliable number in the study.
- Taxes, product costs and currency effects are excluded. A euro investor holding a dollar index carries an exchange-rate risk this study does not model.
Every figure comes from our own price database and is produced by a script in the repository. Running it again with the same cutoff date returns the same numbers. Not investment advice.