Study · Crypto · As of 4 September 2026
Has Bitcoin Become a Normal Asset?
Bitcoin is often described as maturing: less wild, more institutional, closer to a normal portfolio holding. That is a claim about volatility, correlation and drawdowns, and all three can be measured. Two years of daily prices give a clear answer to two of them and refuse to answer the third.
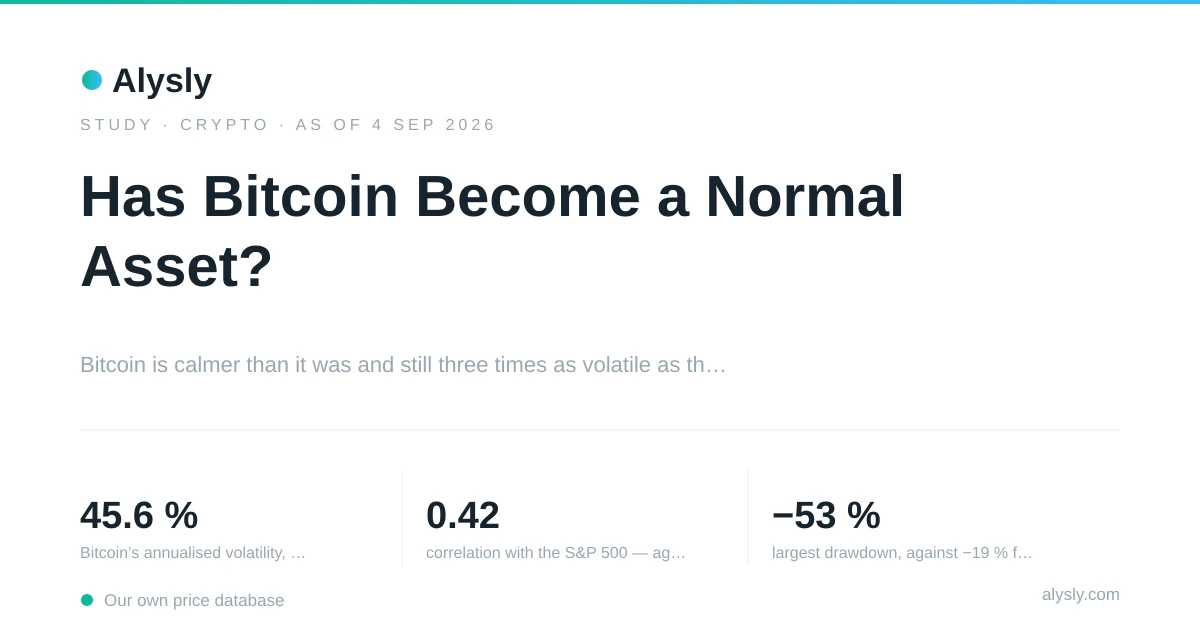
- 45.6 %Bitcoin’s annualised volatility, Jul 2024 – Sep 2026
- 0.42correlation with the S&P 500 — against 0.14 with gold
- −53 %largest drawdown, against −19 % for the S&P 500
- 7.8 %of the 103 coins that existed throughout beat Bitcoin
What “normal” would have to mean
Saying an asset has become normal is not a mood, it is a set of measurable claims. A normal portfolio holding does not swing three times as hard as the stock market. It does not lose half its value while equities lose a fifth. And it either moves with the rest of the portfolio or against it in a way that stays recognisable, because that is what makes it usable in an allocation.
Our crypto history begins on 11 July 2024, so this study covers a little over two years. In that time Bitcoin returned 38.9 %, or 16.5 % a year. That is the least interesting number here. The interesting ones are about how it got there.
Calmer than it was — and still in a different league
Volatility is the one property of a market that behaves predictably: quiet periods follow quiet periods. So if Bitcoin is settling down, a rolling measure should show it.
Loading figure …
It does, up to a point. The median rolling volatility falls from 52.9 % in the first half of the window to 43.7 % in the second. Over the whole period Bitcoin ran at 45.6 % a year.
The comparison is what puts that in proportion. The S&P 500 currently sits at 14 %. Bitcoin has become roughly a fifth calmer than it was two years ago, and it is still moving about three times as much as the equity market it is increasingly held alongside. A holding that swings three times as hard as your index fund is not a normal holding; it is a position that determines the risk of the whole portfolio at a fraction of its weight.
The drawdown figures say the same thing in a form investors feel more directly. Bitcoin’s worst peak-to-trough decline in the window is −53.0 %, reached at the end of June 2026. The S&P 500’s worst is −19.0 %. By the arithmetic of recoveries, the first needs +113 % to get back, the second +23 %.
It moves with technology, not with gold
The second claim behind “normal asset” is about the role Bitcoin plays in a portfolio. Two stories compete. In one it is digital gold, an asset that goes its own way when markets fall. In the other it is a high-beta technology position that rises and falls with risk appetite.
Loading figure …
Over the full window the correlation with the S&P 500 is 0.42 and with the Nasdaq 100 0.41. With gold it is 0.14. Averaged across two years, Bitcoin is three times as connected to equities as to the metal it is usually compared with, and the rolling line against equities rarely drops below zero.
The rolling view also shows why an average is a weak summary. The correlation with equities has ranged from 0.24 to 0.59, the one with gold from −0.04 to 0.53, and in the most recent 90-day window the order has reversed: 0.53 against gold, 0.30 against the S&P 500. Whether that is a lasting change of regime or a passing episode cannot be decided from one 90-day window, and this study does not try. What it rules out is the idea that Bitcoin has one stable relationship to anything.
The sharper test is what happens when equities fall hard. On the 20 worst days for the S&P 500 in this window, the index lost 2.64 % on average. On the same days Bitcoin lost 3.05 % on average and closed lower on 80 % of them. Gold gained 0.06 %.
Loading figure …
That is the opposite of what a hedge does. On the days a portfolio most needs an asset to go its own way, Bitcoin amplified the loss. Gold, whatever else can be said about it, did not.
So Bitcoin has become normal in one specific sense: it behaves like a familiar type of holding — a leveraged bet on risk appetite. It has not become normal in the sense the word usually implies, which is diversification.
Inside its own market, it is the establishment
The third change is easier to miss because it happened to everything around Bitcoin rather than to Bitcoin itself.
Of the 103 coins that already traded when our Bitcoin series begins, exactly 8 — 7.8 % — beat Bitcoin over the same window. (Widening the field to all 273 coins with at least 400 days gives 3.3 %, but that comparison is unfair to the newcomers: a coin listed in 2025 runs a shorter distance and loses by construction.) The altcoin season index, which measures how many of the largest 50 coins outperform Bitcoin over 90 days, stands at 42 out of 100. Over 697 days it recorded 6 altcoin seasons totalling 37 days, against 28 Bitcoin seasons totalling 289 days.
Read together: for eight times as many days as the rest of the market had its moment, Bitcoin had its own. The asset once treated as the speculative end of the spectrum is now the conservative choice within its own asset class — which says less about Bitcoin becoming safe than about what surrounds it.
What this data cannot answer
The honest limit of this study is its window. Two years and two months contain one large drawdown and one recovery. They contain no halving cycle, no multi-year bear market, and no comparison with 2017 or 2021, because our crypto history simply does not go back that far. Anyone claiming that Bitcoin’s volatility is on a long-term downward path needs a decade of data; what we can show is a decline within one window, which is a much weaker statement and is presented as such.
Two further limits belong here. The breadth comparison counts coins that still exist, so the 7.8 % share flatters the competition rather than Bitcoin. And a correlation of 0.42 is an average of a moving relationship, not a constant: the rolling line ranges widely, and any allocation decision built on the average alone would be built on a number that was rarely the current one.
The short answer
More normal than it was: volatility down by roughly a fifth, an increasingly clear role in the portfolio, and a dominant position inside its own market.
Not a normal asset: still three times as volatile as equities, a drawdown nearly three times as deep, and a correlation profile that makes it an amplifier of equity risk rather than a counterweight to it.
If the question is whether Bitcoin can be held like a normal position, the data answers with a portfolio point rather than an opinion. At 45.6 % volatility, a 5 % allocation contributes roughly as much risk as 15 % in the S&P 500. That is the number to size against — not the story about maturing.
Data and method
- Data basis
- cx:btc · 11 Jul 2024 to 4 Sep 2026 · 0 trading sessions
- The window is 11 July 2024 to 4 September 2026, which is what our own daily crypto history covers. That is roughly two years and one Bitcoin drawdown — enough for volatility and correlation, and far too short for a statement about market cycles. Nothing here compares 2026 with 2017 or 2021, because we hold no such data.
- Bitcoin trades every day, equities do not. Volatility is annualised with 365 days for crypto and 252 for equities, which is the convention that keeps the two comparable rather than flattering either.
- Correlations are Pearson correlations of daily returns on the days both markets traded, over a rolling 90-day window. Correlation of levels would be meaningless here: two rising series always look related.
- The breadth figure counts only the 103 coins that already traded when the Bitcoin series begins, so every coin is measured over the same window. Counting all 273 coins with at least 400 days instead gives 3.3 %, but that number is misleading: coins listed later run a shorter distance and lose by construction. Coins that were delisted or never listed are in neither figure, which flatters the survivors rather than Bitcoin.
Every figure comes from our own price database and is produced by a script in the repository. Running it again with the same cutoff date returns the same numbers. Not investment advice.