Altcoin Season Index
The index measures one question: how many of the 50 largest altcoins beat Bitcoin over the past 90 days? At 75 % or above it is altcoin season — market breadth is carrying returns. At 25 % or below it is Bitcoin season: capital concentrates in the largest asset. In between it is neither.
For a portfolio this is not a buy or sell signal but a breadth measure — much like asking whether an equity index is carried by a few heavyweights or by many constituents.
Neither altcoin nor Bitcoin season
36/ 100
Bitcoin season ≤ 25Altcoin season ≥ 75
36 % of 50 evaluated top altcoins beat Bitcoin over 90 days. Bitcoin itself is at +17.3 % over that period. As of 2026-09-15.
Index history
Bitcoin season Altcoin season
The last Bitcoin season ran from 2026-05-28 to 2026-05-29 (2 days), the last altcoin season from 2025-10-02 to 2025-10-03 (2 days).
707 days since 2024-10-09 — that is how far our price history reaches for all coins involved.
Season statistics
| Altcoin | Bitcoin | |
|---|---|---|
| Days since last season | 347 | 109 |
| Seasons in the period | 6 | 30 |
| Avg. days between seasons | 56 | 10 |
| Longest streak without a season | 274 | 97 |
| Avg. length of a season (days) | 5 | 10 |
| Longest season (days) | 10 | 76 |
| Total days in season | 29 | 309 |
Top altcoins over the last 90 days
Marked green: beat Bitcoin. Click through for the coin page with chart, risk and correlation figures.
| # | Coin | 90 days | vs Bitcoin |
|---|---|---|---|
| 1 |  PUMP PUMP PUMP PUMP | +138.3 % | beats BTC |
| 2 |  ZEC ZEC ZEC ZEC | +132.7 % | beats BTC |
| 3 |  Uniswap UNI Uniswap UNI | +97.3 % | beats BTC |
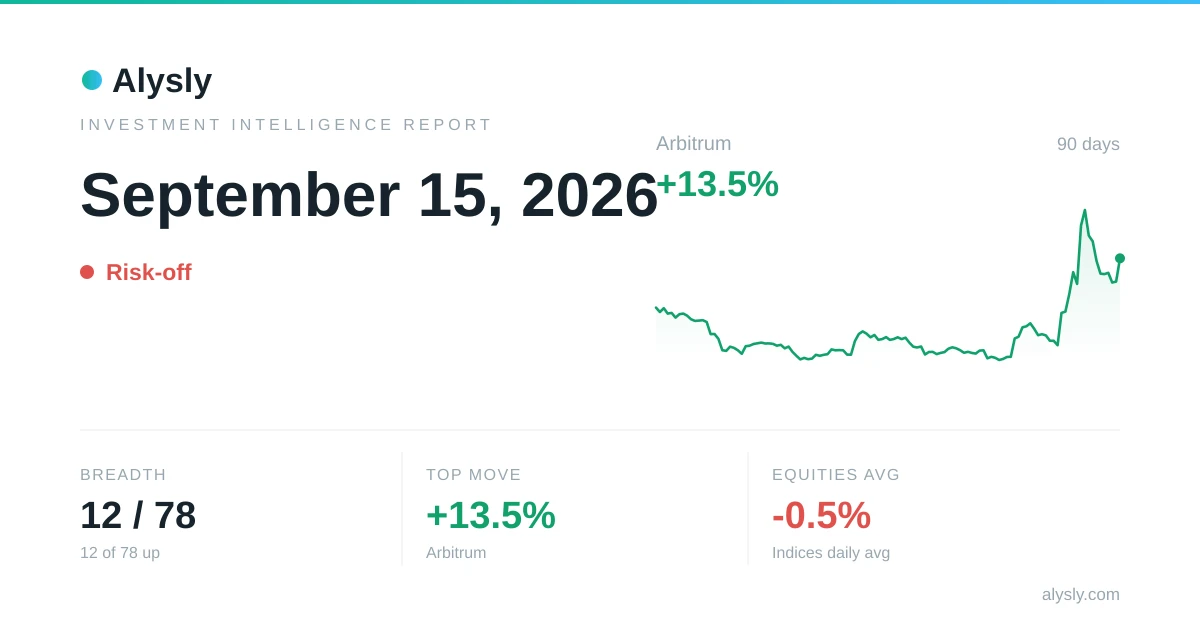
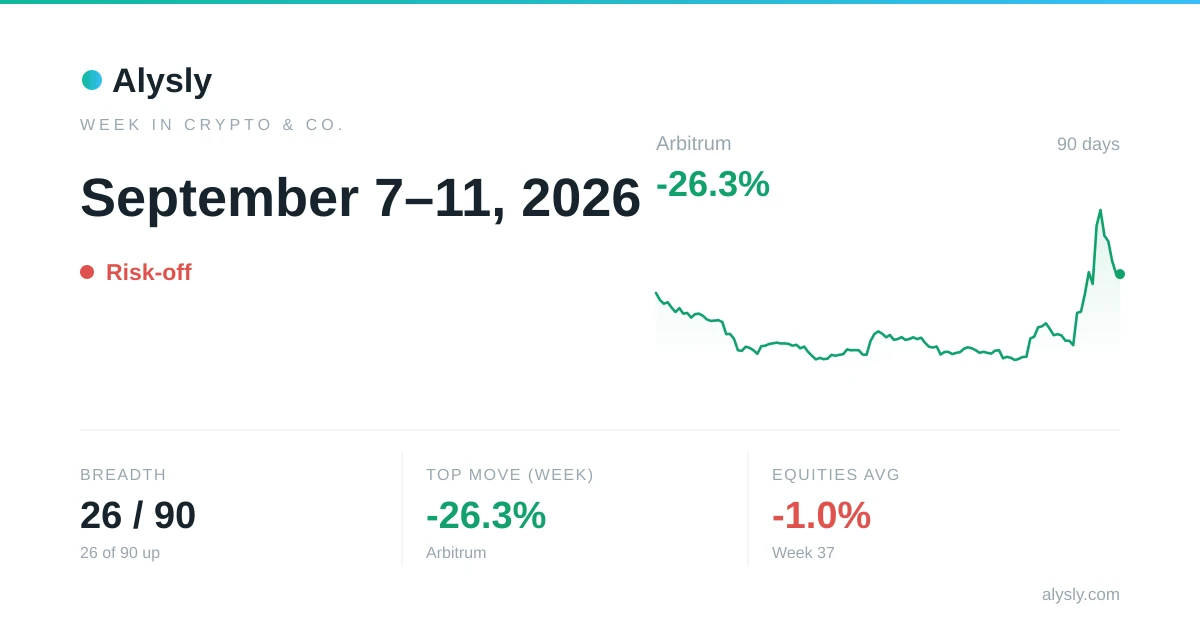
| 4 |  Arbitrum ARB Arbitrum ARB | +77.1 % | beats BTC |
| 5 |  Aave AAVE Aave AAVE | +65.4 % | beats BTC |
| 6 |  CAKE CAKE CAKE CAKE | +60.0 % | beats BTC |
| 7 |  ETHFI ETHFI ETHFI ETHFI | +55.2 % | beats BTC |
| 8 |  ENA ENA ENA ENA | +46.8 % | beats BTC |
| 9 |  CRV CRV CRV CRV | +40.6 % | beats BTC |
| 10 |  VET VET VET VET | +40.2 % | beats BTC |
| 11 |  DASH DASH DASH DASH | +39.0 % | beats BTC |
| 12 |  JST JST JST JST | +38.4 % | beats BTC |
| 13 |  Ethereum ETH Ethereum ETH | +37.0 % | beats BTC |
| 14 |  Solana SOL Solana SOL | +34.5 % | beats BTC |
| 15 |  Chainlink LINK Chainlink LINK | +34.5 % | beats BTC |
| 16 |  STX STX STX STX | +23.5 % | beats BTC |
| 17 |  POL POL POL POL | +21.1 % | beats BTC |
| 18 |  BNB BNB BNB BNB | +18.4 % | beats BTC |
| 19 |  Cardano ADA Cardano ADA | +17.1 % | weaker |
| 20 |  PEPE PEPE PEPE PEPE | +14.6 % | weaker |
| 21 |  Litecoin LTC Litecoin LTC | +14.1 % | weaker |
| 22 |  XRP XRP XRP XRP | +8.1 % | weaker |
| 23 |  Avalanche AVAX Avalanche AVAX | +7.4 % | weaker |
| 24 |  SKY SKY SKY SKY | +7.2 % | weaker |
| 25 |  NEAR NEAR NEAR NEAR | +7.1 % | weaker |
| 26 |  ICP ICP ICP ICP | +5.9 % | weaker |
| 27 |  MORPHO MORPHO MORPHO MORPHO | +5.0 % | weaker |
| 28 |  TRON TRX TRON TRX | +3.4 % | weaker |
| 29 |  Filecoin FIL Filecoin FIL | +2.2 % | weaker |
| 30 |  Bitcoin Cash BCH Bitcoin Cash BCH | +2.0 % | weaker |
| 31 |  XAUT XAUT XAUT XAUT | +0.5 % | weaker |
| 32 |  PAXG PAXG PAXG PAXG | +0.3 % | weaker |
| 33 |  Shiba Inu SHIB Shiba Inu SHIB | +0.0 % | weaker |
| 34 |  Injective INJ Injective INJ | -0.2 % | weaker |
| 35 |  Ethereum Classic ETC Ethereum Classic ETC | -1.8 % | weaker |
| 36 |  TRUMP TRUMP TRUMP TRUMP | -1.8 % | weaker |
| 37 |  ASTER ASTER ASTER ASTER | -5.2 % | weaker |
| 38 |  Polkadot DOT Polkadot DOT | -5.9 % | weaker |
| 39 |  Dogecoin DOGE Dogecoin DOGE | -6.8 % | weaker |
| 40 |  Hedera HBAR Hedera HBAR | -8.6 % | weaker |
| 41 |  WLFI WLFI WLFI WLFI | -9.2 % | weaker |
| 42 |  ONDO ONDO ONDO ONDO | -10.1 % | weaker |
| 43 |  ALGO ALGO ALGO ALGO | -10.4 % | weaker |
| 44 |  Sui SUI Sui SUI | -10.5 % | weaker |
| 45 |  TAO TAO TAO TAO | -11.6 % | weaker |
| 46 |  Aptos APT Aptos APT | -18.6 % | weaker |
| 47 |  Cosmos ATOM Cosmos ATOM | -20.1 % | weaker |
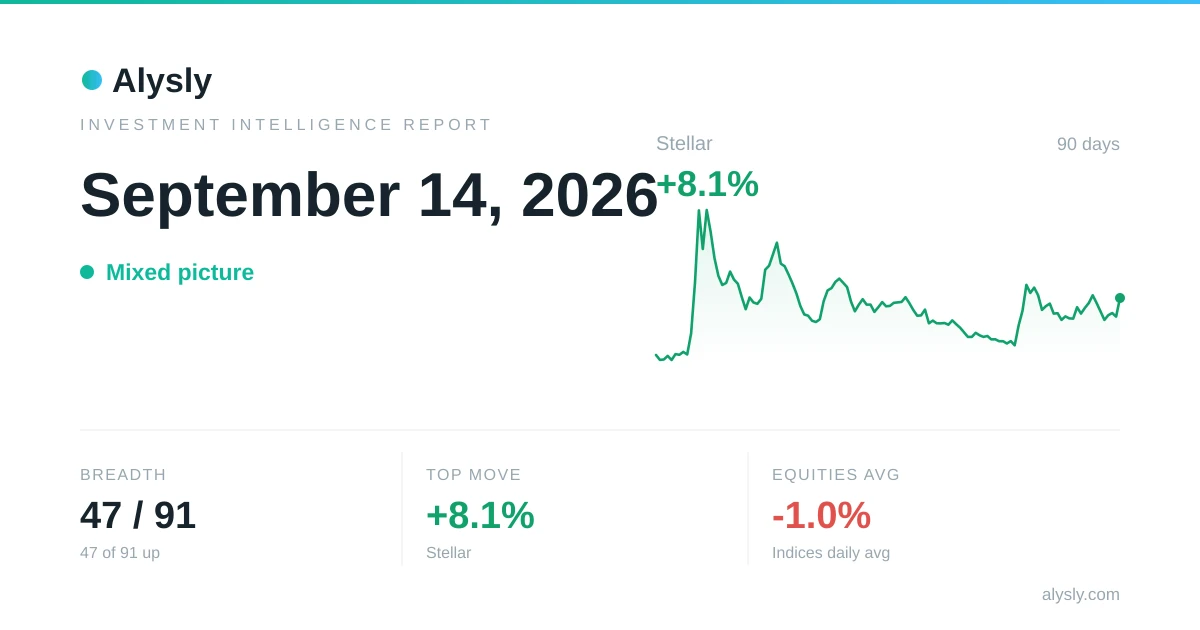
| 48 |  Stellar XLM Stellar XLM | -21.9 % | weaker |
| 49 |  RENDER RENDER RENDER RENDER | -22.2 % | weaker |
| 50 |  WLD WLD WLD WLD | -45.0 % | weaker |
Method and limitations
- Based on daily closing prices against the US dollar, comparing returns over 90 calendar days.
- Stablecoins are not excluded by a name list but detected by their price moving less than 2 % over the period. Wrapped representations such as WBTC or stETH are excluded too — they track their underlying.
- Survivorship bias: The selection is based on today's market capitalization. We have no historical rankings, so the backward view omits coins that were large then and are small now.
- The history starts 2024-10-09, because that is where our price data begins. All streak figures refer to those 707 days.
- The index is a breadth measure, not a buy or sell signal.