Correlation Matrix
The matrix shows how closely assets have moved together from day to day. It is based on daily returns over the last 90 trading days for indices, commodities, precious metals, currency pairs, cryptocurrencies and stocks with a price chart. Green means they moved together, red means they moved in opposite directions.
Loading …
How the Matrix Is Built
For each symbol, we compute the percentage change from one daily close to the next. For each pair, that gives a Pearson correlation coefficient over the trading days both share within the 90-day window. It ranges from −1 to +1:
- +1: Both series move in step, on rising and falling days alike.
- 0: No linear relationship. The move of one series says nothing about the other.
- −1: The series move as mirror images.
The matrix covers 737 symbols, most of them single stocks. Indices, commodities with currencies, and crypto are selected by default. Stocks can be switched on; with all of them, the table becomes too large to read. The filter box narrows the rows, for example to DAX, BTC or a ticker.
How to Read the Values
Correlation measures direction, not size. Two stocks with a correlation of 0.9 usually rise and fall together, but one of them may swing twice as far. How volatile an asset is does not show up in the correlation.
Over a 90-day window, values between −0.2 and +0.2 are hard to tell apart from chance. Clear values carry meaning, and only for that period.
Stocks from the same sector and country tend to move closely together. Gold and currencies often show low values against stocks. Such patterns can change quickly. In sharp sell-offs, correlations between risky assets often rise at the same time, which is exactly when diversification would matter most.
Limits
- Past data. 90 days are a snapshot. Over one year or ten years, the values can look very different.
- Trading hours. Asian, European and US exchanges close at different times, and crypto trades around the clock. News during the US afternoon only shows up in the next day’s return for Asian markets, which pushes down correlations across time zones.
- Linear relationships. Pearson captures moves in the same direction. Links that only appear in extreme phases are poorly reflected.
The portfolio backtester uses our price series to show how a diversified mix would have behaved over longer periods. The portfolio X-ray shows which stocks sit in several ETFs at once.
More calculators and tools are listed in the tools overview.
Latest Investment Analysis
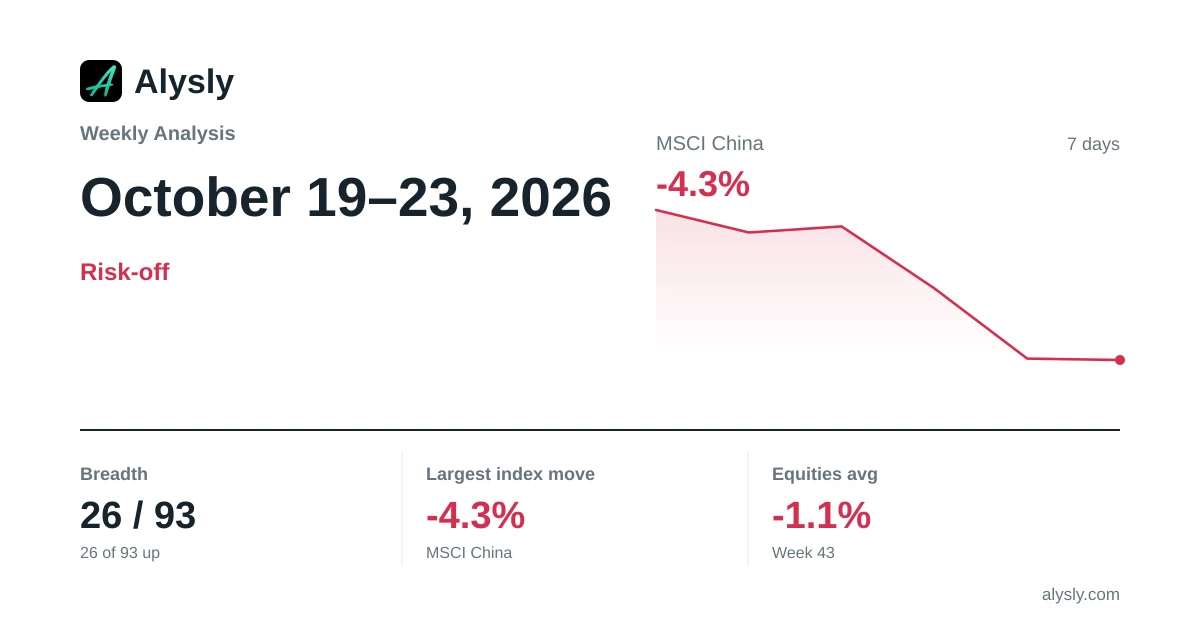 · Risk-off
Weekly Analysis: A Quiet Week, MSCI China -4.3% · October 19–23, 2026
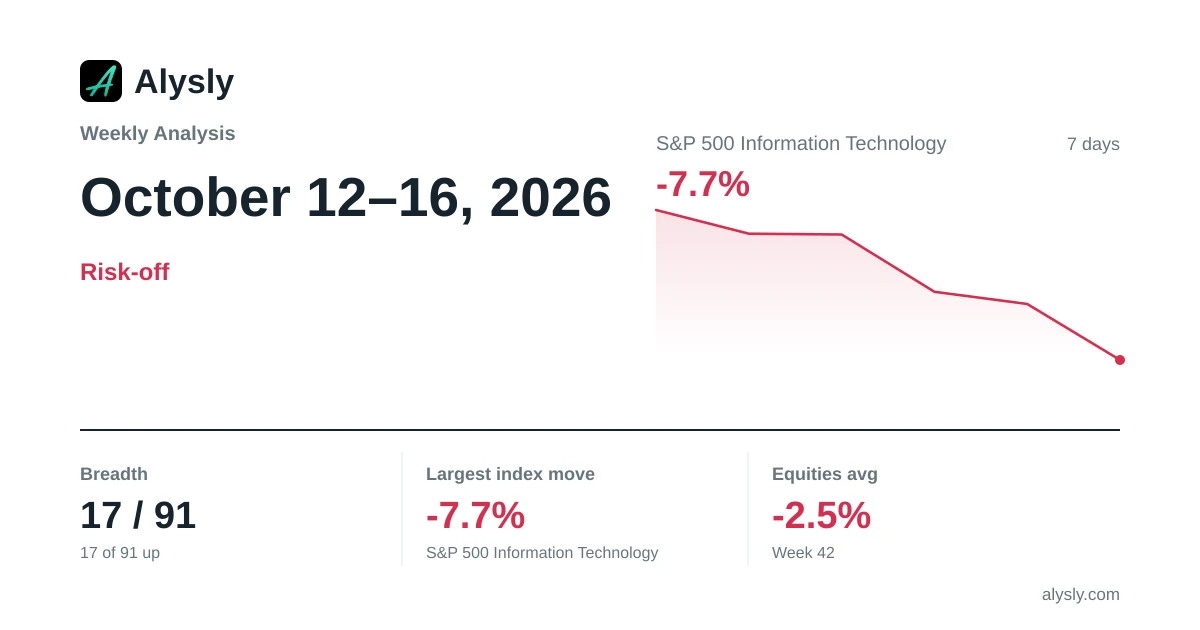 · Risk-off
Weekly Analysis: S&P 500 Information Technology Weighs on the Week (-7.7%) · October 12–16, 2026
 · Mixed
Weekly Analysis: MSCI China Leads the Week (+2.6%) · October 5–9, 2026
 · Mixed
Weekly Analysis: Nikkei 225 Sets the Tone for the Week (+3.4%) · September 28 – October 2, 2026
 · Risk-on
Weekly Analysis: S&P 500 Information Technology Leads the Week (+3.5%) · September 21–25, 2026
Updated · Content and figures checked