ETF Portfolio Backtester
The backtester replays a mix of stock indices, precious metals, commodities, currencies and crypto with weights of your choice. It shows how €10,000 split that way would have developed and what losses would have occurred along the way. Past values are not a forecast.
How the Backtest Works
There are 16 series from our price data to choose from. The S&P 500, Nasdaq 100, Russell 2000 and Dow Jones stock indices run through their futures. The others are gold, silver, platinum and palladium, WTI and Brent crude, copper, the EUR/USD, GBP/USD and USD/JPY exchange rates, and Bitcoin and Ethereum.
- For each series, the last price of every month counts.
- The calculation only covers months that all selected positions share. The shortest series sets the period.
- Weights are normalized to 100% and restored every month. If gold rises more than the S&P 500, the model shifts back to the target weights.
- The portfolio’s monthly return is the weighted sum of the positions’ monthly returns.
That produces the metrics. Annual return is the average annual return over the period. Max drawdown is the largest fall from a peak to the following low. Volatility is the standard deviation of monthly returns, scaled to a year. Best and worst calendar years complete the picture.
Examples From the Price Data
Monthly values through September 2026 (as of September 16, 2026):
| Mix | Period | From €10,000 | Annual return | Max drawdown | Volatility |
|---|---|---|---|---|---|
| 100% S&P 500 | 04/2017–09/2026 | €29,029 | 12.0% | −24.3% | 16.1% |
| 100% gold | 01/2023–09/2026 | €20,642 | 21.9% | −23.9% | 17.5% |
| 60% S&P 500, 40% gold | 01/2023–09/2026 | €18,640 | 18.5% | −8.6% | 11.0% |
| 100% Bitcoin | 07/2024–09/2026 | €11,791 | 7.9% | −49.4% | 44.9% |
| 80% S&P 500, 20% Bitcoin | 07/2024–09/2026 | €12,655 | 11.5% | −13.9% | 15.9% |
Over the same period, the S&P 500 and gold mix had a much smaller drawdown than either position on its own. The periods differ widely, though. Comparing rows with different periods says little, and three years is short for conclusions about asset classes.
What the Backtest Does Not Capture
- Currency. All series are quoted in US dollars or as exchange rates. For a euro-based investor, the dollar’s own moves come on top.
- Dividends and futures. The indices run through futures. Their price includes no dividends but does reflect financing costs. Before September 2024, contract rolls can show up as small jumps in the futures series.
- Costs and taxes. Monthly rebalancing is assumed to be free. In a real portfolio, each rebalance costs fees and can trigger taxes.
- Short history. Some series only start in 2023 or 2024. Crashes like 2008 or 2020 then fall outside the period.
The correlation matrix shows how these assets have moved relative to each other recently. The Monte Carlo simulator shows how widely future outcomes can spread when returns fluctuate.
More calculators and tools are listed in the tools overview.
Latest Investment Analysis
 · Mixed
Weekly Analysis: MSCI China Leads the Week (+2.6%) · October 5–9, 2026
 · Mixed
Weekly Analysis: Nikkei 225 Sets the Tone for the Week (+3.4%) · September 28 – October 2, 2026
 · Risk-on
Weekly Analysis: S&P 500 Information Technology Leads the Week (+3.5%) · September 21–25, 2026
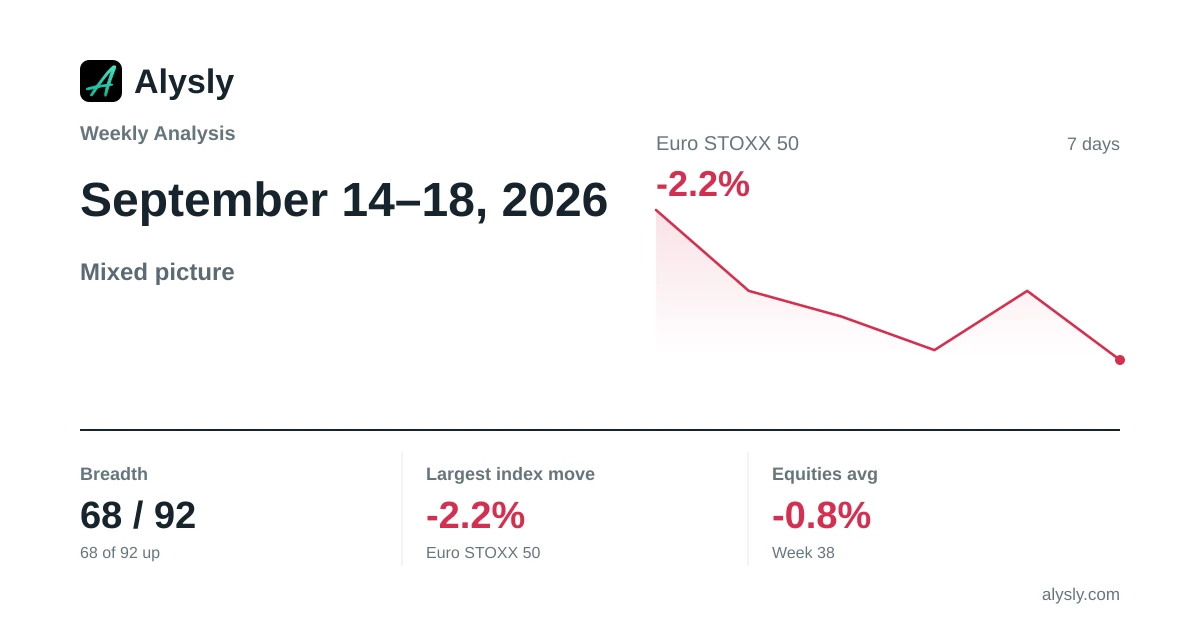 · Mixed
Weekly Analysis: Euro STOXX 50 Weighs on the Week (-2.2%) · September 14–18, 2026
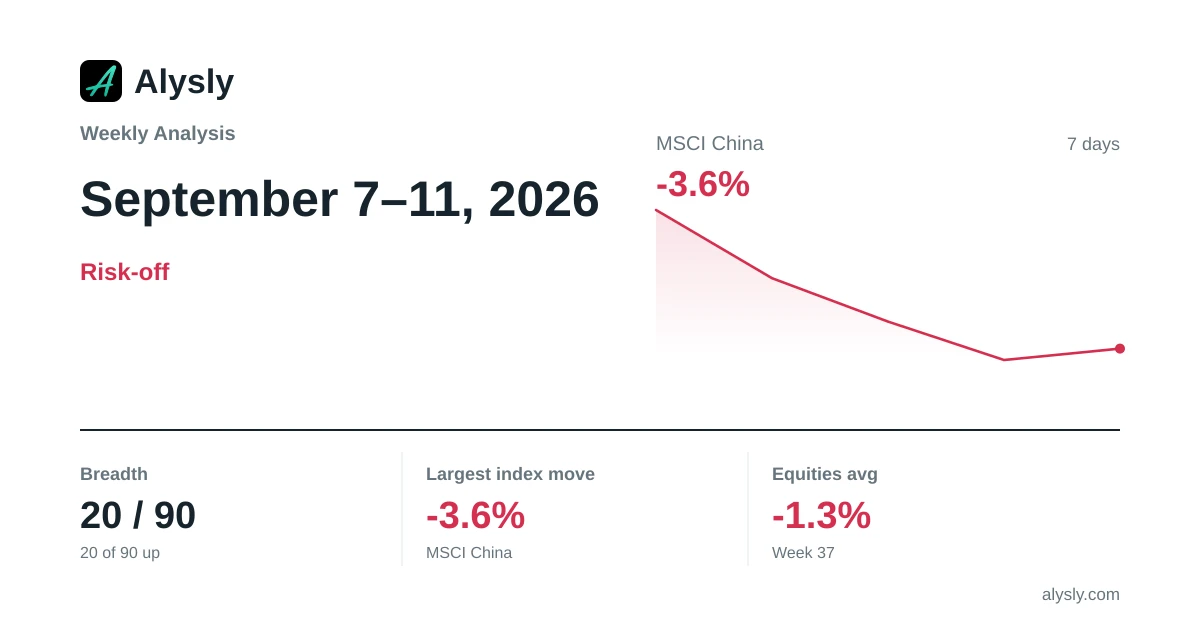 · Risk-off
Weekly Analysis: MSCI China Lags the Week (-3.6%) · September 7–11, 2026