Weekly Analysis: MSCI China Leads the Week (+2.6%) · October 5–9, 2026
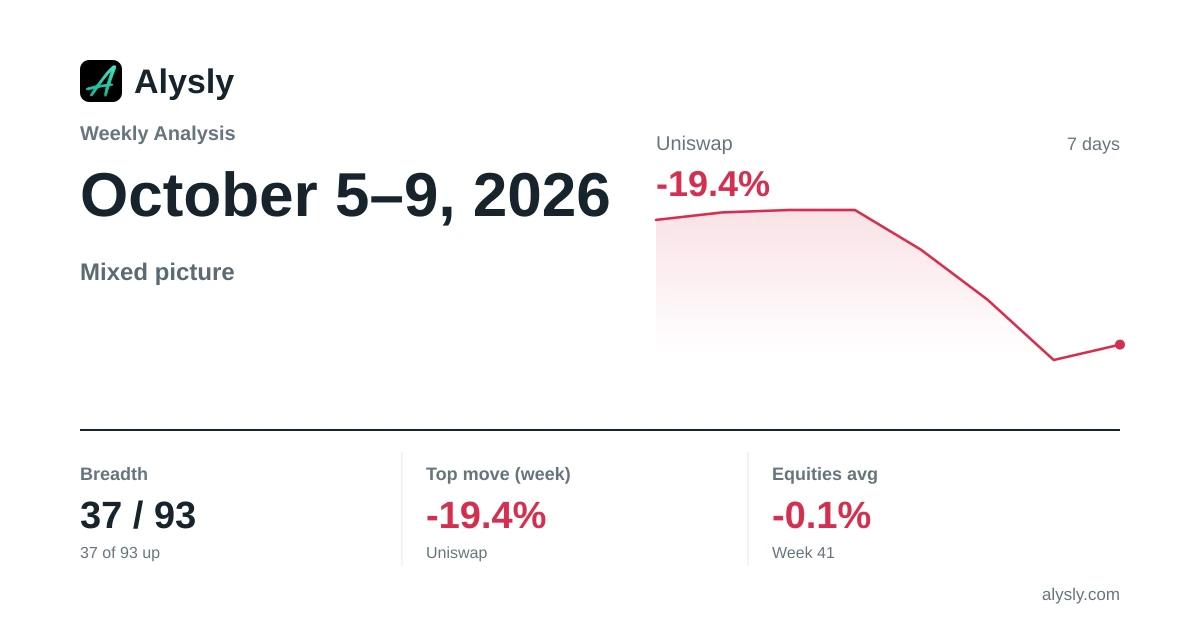
The trading week of October 5–9, 2026 in review: 37 of 93 tracked assets (40%) finished the week higher, with the major equity indices moving -0.1% on average over the week. The analysis covers equities and benchmark indices first, then crypto, commodities, FX and collectibles.
What Stands Out
Measured against our own history, nothing stood out this week: no benchmark index moved as much as it had in the past six months, and the count of new 52-week highs and lows stayed within the range of recent weeks.
Rule: a benchmark index is listed when its weekly change (Friday to Friday) is its largest in that direction for at least 26 weeks. The count of new 52-week highs or lows appears when it is the highest of the last 13 weeks and at least 5. Based on closing prices in our own database.
Weekly Barometer
Weekly change = weekend close versus roughly five trading days earlier.
Indices Over the Week


Stocks: Weekly Gainers & Losers
Gainers
| Name | Price | Change |
|---|---|---|
| XP Inc. Class A XP | $32.22 | +49.86% |
| Inter & Co. Inc. Class A INTR | $7.68 | +40.15% |
| PTC Inc. PTC | $194.45 | +35.01% |
| StoneCo Ltd. Class A STNE | $12.46 | +30.47% |
| Banzai International, Inc. PARA | $0.6617 | +26.67% |
| Pagseguro Digital Ltd. Class A PAGS | $11.16 | +23.73% |
| Vinci Compass Investments LTD Clas VINP | $11.54 | +22.12% |
| Novavax Inc. NVAX | $12.75 | +21.89% |
Losers
| Name | Price | Change |
|---|---|---|
| AMTD Idea Group AMTD | $0.5111 | -31.28% |
| IREN IREN | $35.19 | -15.73% |
| CNH Industrial N.V. CNH | $11.39 | -15.44% |
| MARA Holdings Inc. MARA | $9.65 | -14.07% |
| 10x Genomics, Inc. TXG | $80.65 | -13.74% |
| ARM Holdings American Depositary ARM | $266.28 | -13.40% |
| Wolfspeed Inc WOLF | $30.61 | -13.24% |
| AST SpaceMobile Inc. Class A ASTS | $50.97 | -12.81% |
From the US stocks Alysly charts. Weekly swings in single names can be far larger than those of the indices.
Crypto, Commodities and FX
Crypto moved +3.0% on average for the week, led by RLC (+183.9%). Precious metals came in at +0.0%, energy and industrial commodities at +2.0%.
Crypto: Weekly Gainers & Losers
Gainers
 RLC
RLC MAGIC
MAGIC OGN
OGN KAIA
KAIA BAT
BAT STRK
STRK MINA
MINA Uniswap
 PUMP
PUMP FET
FET Bitcoin Cash
 WLD
WLDCommodities & Metals Over the Week
| Name | Price | Change |
|---|---|---|
| Gold | 4,216.30 | +1.30% |
| Silver | 61.0480 | +1.05% |
| Platinum | 1,693.30 | -0.39% |
| Palladium | 1,150.40 | -1.86% |
| WTI crude | 91.8500 | +0.81% |
| Brent crude | 104.72 | +2.42% |
| Gasoline | 3.2952 | -0.52% |
| Heating oil | 4.7384 | +5.27% |
| Copper | 6.6920 | +2.18% |
FX Over the Week
| Pair | Price | Change |
|---|---|---|
  EUR/USD EUR/USD | 1.1232 | -0.47% |
 GBP/USD GBP/USD | 1.3243 | +0.01% |
 USD/JPY USD/JPY | 157.42 | +0.32% |
 AUD/USD AUD/USD | 0.6976 | +0.48% |
 USD/CAD USD/CAD | 1.4222 | +0.09% |
 USD/CHF USD/CHF | 0.8237 | +0.21% |
Real Assets: The Week's Hammer Prices
This week brought 2 auction records. Real assets are not quoted continuously. Trading happens when a lot is called. What follows is therefore not a weekly return but the sum of what actually changed hands.
| Asset class | Records | Median | Highest hammer price | Price |
|---|---|---|---|---|
| Classic cars | 2 | $209,000 | Porsche 911 Turbo (993) · 1995–1998 Oct 8, 2026 | $291,000 |
No sale was recorded in trading cards this week. The most recent one is 11 days back. Nothing was sold at auction in watches over the week. The last sale on file is 8 days old.
The trading-card price index stands at 621.0 (as of September 28, 2026), +243.1% against a year ago. It measures price changes of the same good, unlike a median, which is made up of different items every week.
Residential property has no weekly figure: the latest official reading is from July 1, 2026, 100 days before this review. United States (Case-Shiller) +2.3% year on year. Germany +0.6% year on year. Euro area +3.8% year on year.
Cross-Asset Correlations
| Pair | r | −1 … +1 |
|---|---|---|
| S&P 500 ↔ Bitcoin | +0.39 | |
| S&P 500 ↔ Gold | +0.38 | |
| Gold ↔ Crude oil (WTI) | -0.17 | |
| EUR/USD ↔ Gold | +0.49 |
Latest Investment Analysis
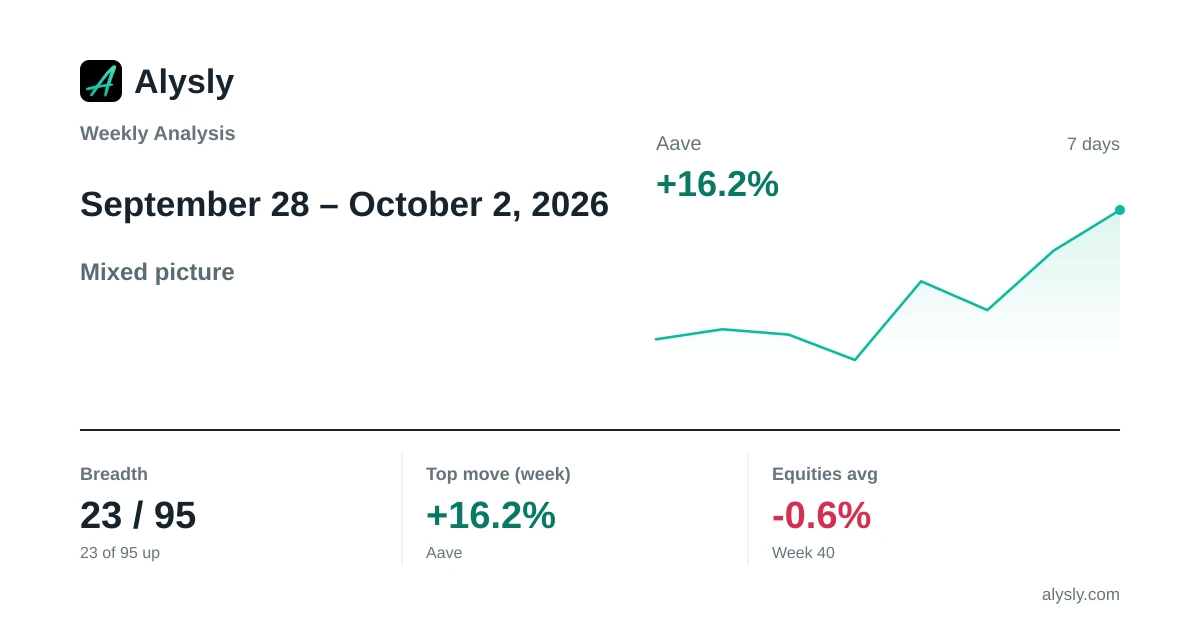 · Mixed
Weekly Analysis: Nikkei 225 Sets the Tone for the Week (+3.4%) · September 28 – October 2, 2026
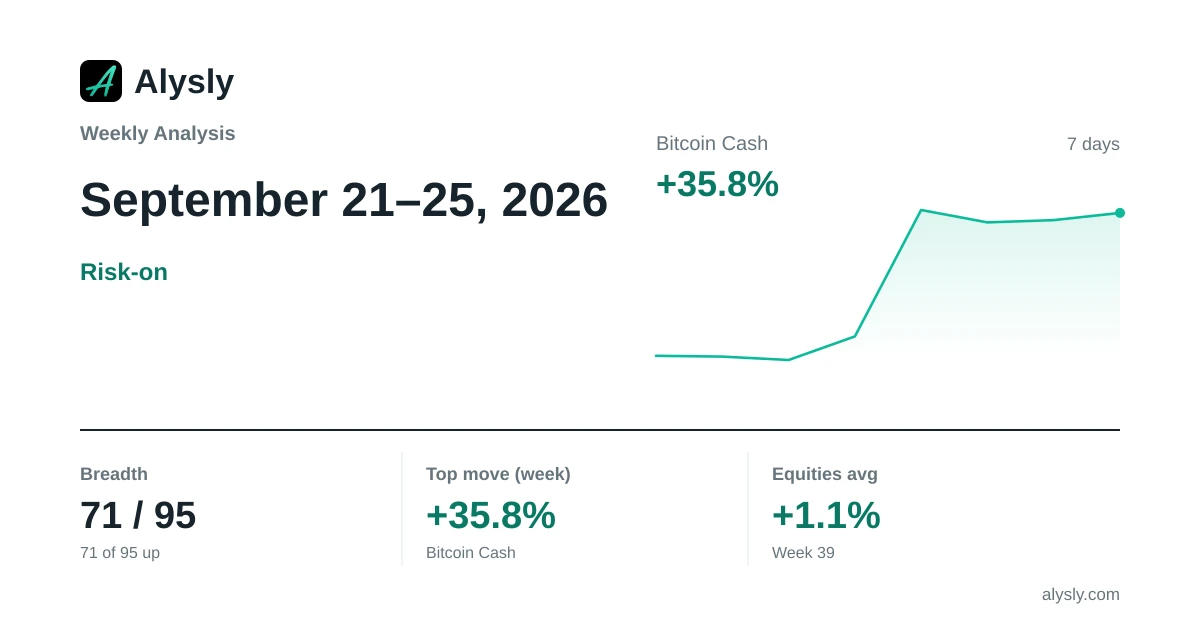 · Risk-on
Weekly Analysis: S&P 500 Information Technology Leads the Week (+3.5%) · September 21–25, 2026
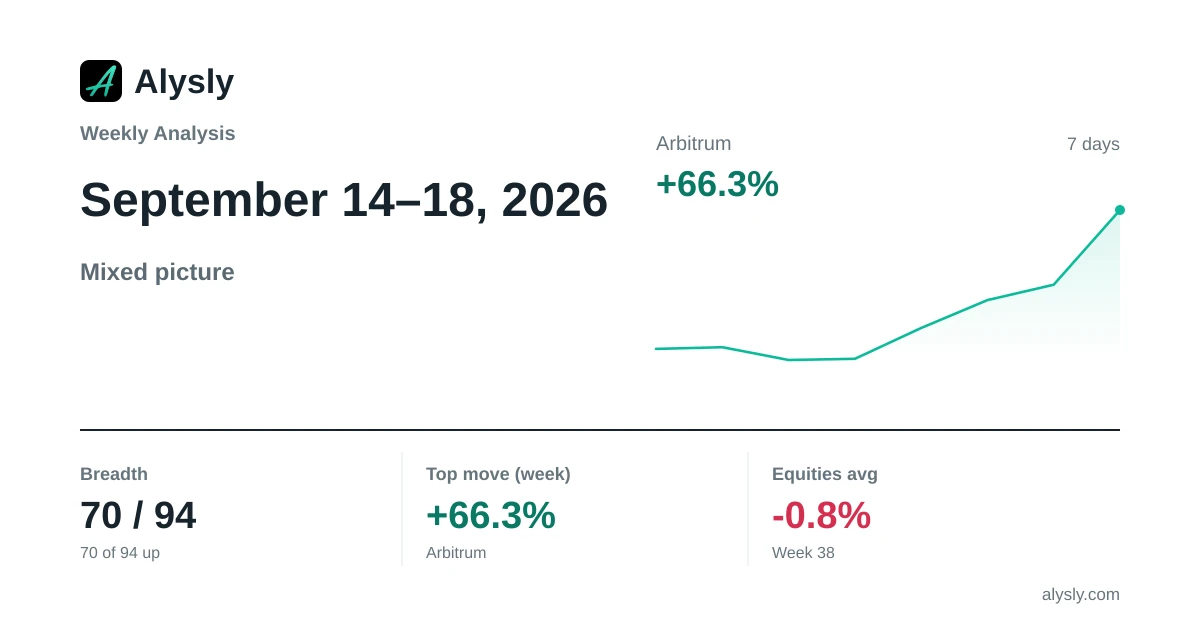 · Mixed
Weekly Analysis: Euro STOXX 50 Weighs on the Week (-2.2%) · September 14–18, 2026
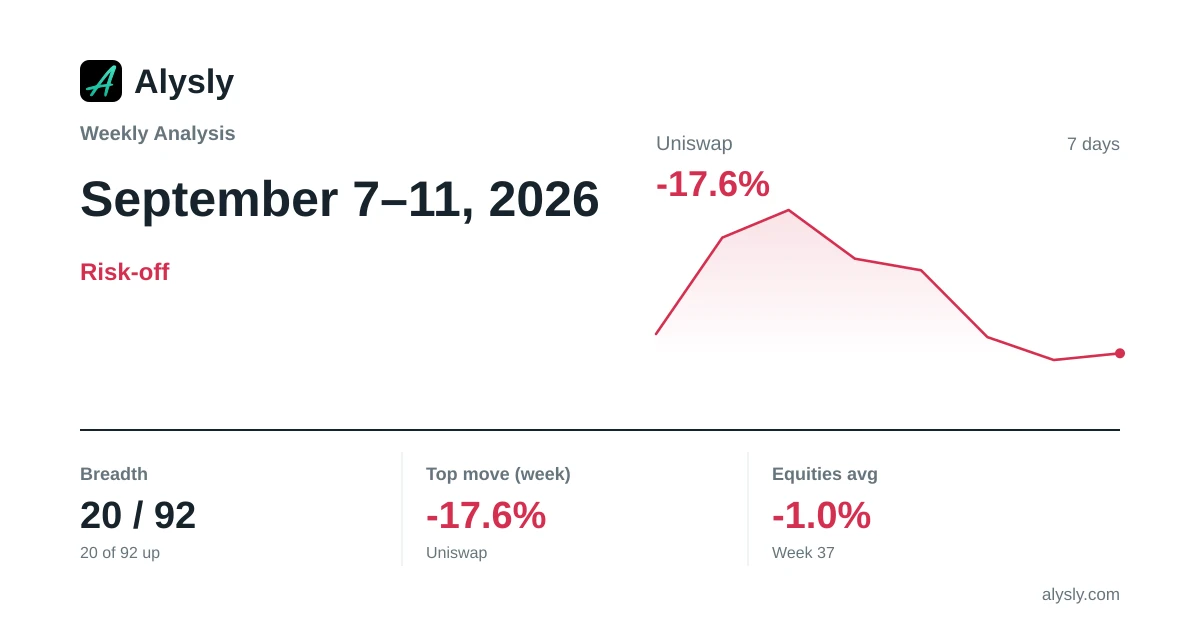 · Risk-off
Weekly Analysis: MSCI China Lags the Week (-2.6%) · September 7–11, 2026
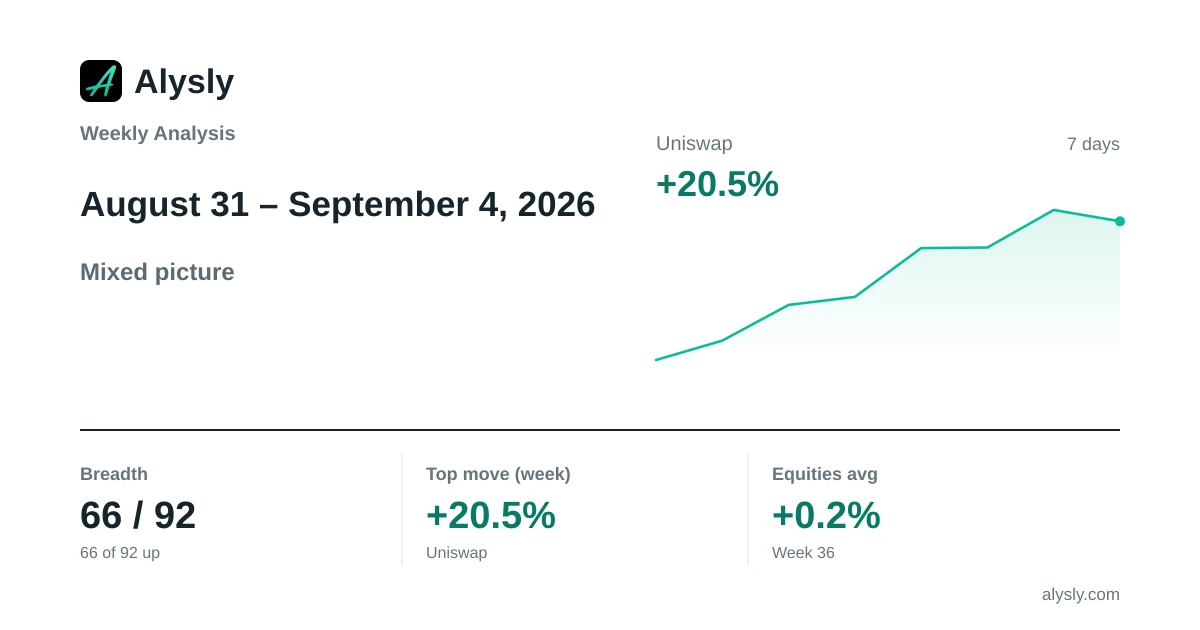 · Mixed
Weekly Analysis: MSCI Japan Sets the Tone for the Week (+2.5%) · August 31 – September 4, 2026