Nikkei 225
The Nikkei 225 covers 225 large companies listed on the Tokyo Stock Exchange. Unlike most indexes it is weighted by share price rather than market value, much like the Dow Jones in the US. A stock with a high price therefore moves the index more than a larger company with a low share price.
2026+27.8 %
1J+45.7 %
52W
ETFs3
The chart shows the net asset value of the iShares Nikkei 225 UCITS ETF in yen, not the index level. The fund reinvests dividends and deducts its costs, so the line differs from the price index.
ETFs tracking this index
Composition – 50 largest holdings
Based on: Xtrackers Nikkei 225 UCITS ETF 1c · as of 2026-09-14 · 225 holdings
| # | Stock | Ticker | Sector | Country | Weight |
|---|---|---|---|---|---|
| 1 |  Advantest Corp. Advantest Corp. | 6857 | Technology | Japan | 11.94 % |
| 2 |  Fast Retailing Co. Ltd. Fast Retailing Co. Ltd. | 9983 | Consumer Goods | Japan | 8.34 % |
| 3 |  Softbank Softbank | 9434 | Telecommunications | Japan | 8.21 % |
| 4 |  Tokyo Electron Ltd. Tokyo Electron Ltd. | 8035 | Technology | Japan | 8.07 % |
| 5 | Country Garden Services Holdings | 6098 | Industrials | Japan | 2.43 % |
| 6 |  TDK Corporation TDK Corporation | 6762 | Technology | Japan | 2.20 % |
| 7 |  Ibiden Co. Ltd. Ibiden Co. Ltd. | 4062 | Technology | Japan | 2.05 % |
| 8 |  Kioxia Holdings Corporation Kioxia Holdings Corporation | 285A | Japan | 1.98 % | |
| 9 |  KDDI Corporation KDDI Corporation | 9433 | Telecommunications | Japan | 1.90 % |
| 10 |  Fujikura Ltd Fujikura Ltd | 5803 | Industrials | Japan | 1.57 % |
Show holdings 11 to 50
 Shin-Etsu Chemical Co. Ltd. 1.50 %
 Fanuc Corporation 1.50 %
 Kyocera Corporation 1.48 %
 Toyota Tsusho Corp. 1.18 %
 Daikin Industries Ltd. 1.09 %
 KONAMI Group Corporation 1.08 %
 Chugai Pharmaceutical Co. Ltd. 1.01 %
- Sony Group Corporation 0.95 %
- Terumo Corporation 0.94 %
 Murata Manufacturing Co. Ltd. 0.92 %
- Bandai Namco Holdings Inc. 0.84 %
- Nitto Denko Corp. 0.84 %
- Al-Elm Information Security 0.79 %
 Mitsubishi Corporation 0.79 %
 Lasertec Corp. 0.72 %
- Secom Co. Ltd. 0.66 %
 Tokio Marine Holdings Inc. 0.63 %
 Itochu Corporation 0.60 %
 Otsuka Corp. 0.59 %
 Hoya Corp. 0.59 %
- Astellas Pharma Inc. 0.59 %
- Disco Corporation 0.54 %
 Mitsui & Co.Ltd 0.53 %
- Honda Motor Co. Ltd. 0.52 %
- Ajinomoto Co. Inc. 0.52 %
- SCREEN Holdings Co. Ltd 0.51 %
 FUJIFILM Holdings Corp 0.51 %
- Taiyo Yuden Co. Ltd. 0.48 %
- Shionogi & Co. Ltd. 0.44 %
- Chang Hwa Commercial Bank Ltd. 0.44 %
 Daiichi Sankyo Company Limited 0.44 %
- Sumitomo Electric Industries Ltd. 0.44 %
- Suzuki Motor Corp. 0.43 %
 Nintendo Co. Ltd. 0.43 %
- Nitori Holdings Co. Ltd. 0.42 %
- Ryohin Keikaku Co. Ltd. 0.42 %
 Olympus Corp. 0.41 %
- Nissan Chemical Corporation 0.41 %
 Denso Corp. 0.40 %
 Bridgestone Corporation 0.40 %
Sectors
Countries
Performance
| Year to date | +27.8 % | 1 month | -5.2 % |
|---|---|---|---|
| 3 months | -3.0 % | 1 year | +45.7 % |
| Calendar year 2011 | -16.2 % | ||
| Calendar year 2012 | +24.8 % | ||
| Calendar year 2013 | +58.3 % | ||
| Calendar year 2014 | +8.1 % | ||
| Calendar year 2015 | +10.1 % | ||
| Calendar year 2016 | +1.7 % | ||
| Calendar year 2017 | +20.4 % | ||
| Calendar year 2018 | -10.9 % | ||
| Calendar year 2019 | +19.9 % | ||
| Calendar year 2020 | +17.3 % | ||
| Calendar year 2021 | +5.9 % | ||
| Calendar year 2022 | -8.0 % | ||
| Calendar year 2023 | +30.0 % | ||
| Calendar year 2024 | +20.4 % | ||
| Calendar year 2025 | +27.7 % |
Risk metrics
Max drawdown-31.3 %
Volatility p.a.21.2 %
Best year2013: +58.3 %
Worst year2011: -16.2 %
Correlations (90 trading days)
The strongest co-movers on top, the most inverse below. Low or negative values improve portfolio diversification.
| Instrument | r | −1 … +1 |
|---|---|---|
| Western Digital Corporation | +0.51 | |
| Seagate Technology Holdings plc | +0.49 | |
| Sandisk Corporation | +0.46 | |
| Progressive Corporation | -0.45 | |
| Marsh & McLennan Companies Inc. | -0.44 | |
| Mondelez International Inc. Class A | -0.42 |
Next events
Latest Investment Intelligence News: Indices
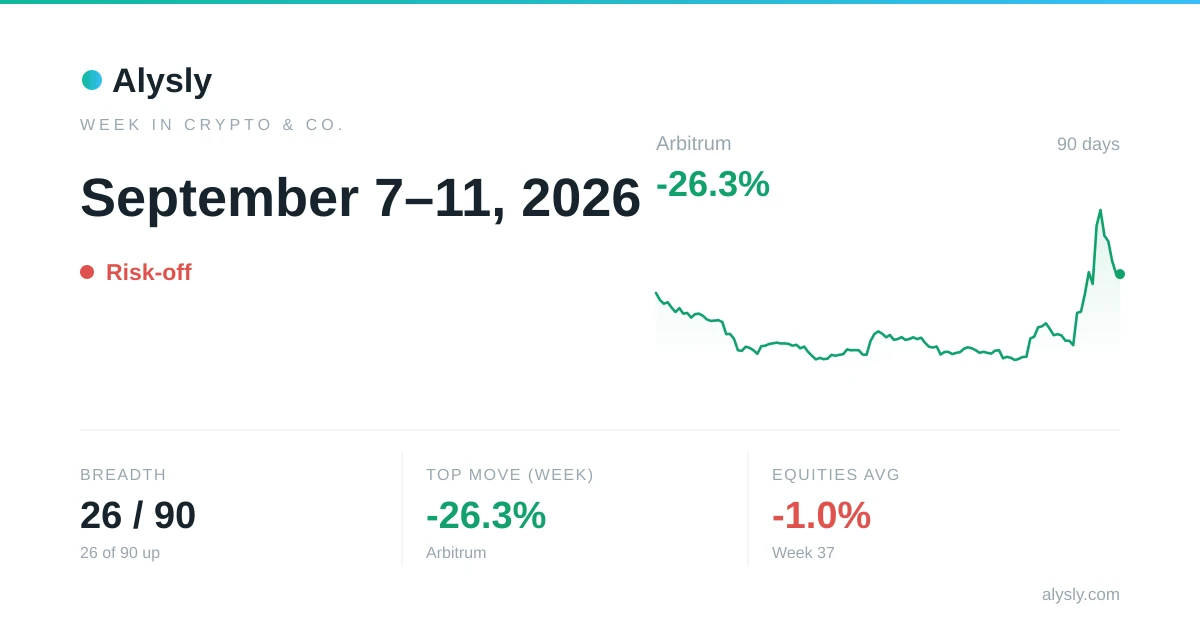 · Risk-off
Crypto, commodities & FX this week: Arbitrum -26.3% · September 7–11, 2026
 · Risk-off
The week in markets: MSCI China lags the week (-2.6%) · September 7–11, 2026
 · Risk-on
Risk appetite lifts markets, with 77% of assets higher – September 11, 2026
 · Risk-off
Broad-based sell-off: just 17 of 91 assets close higher – September 10, 2026
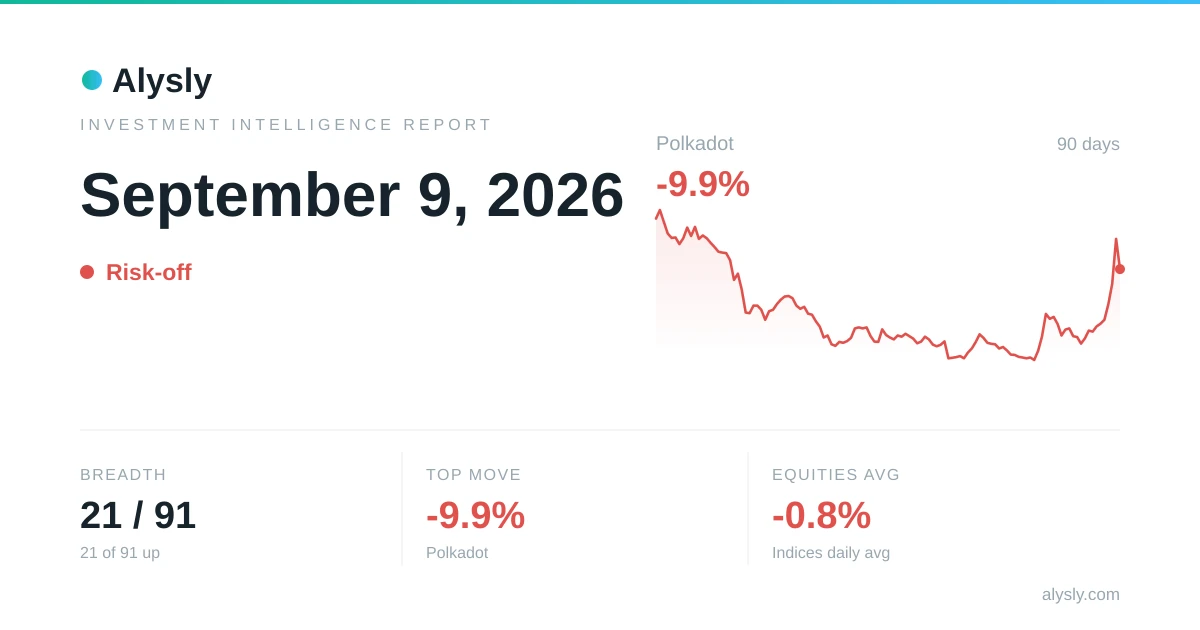 · Risk-off
Red across the board: only 22 of 91 assets hold gains – September 9, 2026