Weekly Analysis: S&P 500 Information Technology Weighs on the Week (-7.7%) · October 12–16, 2026
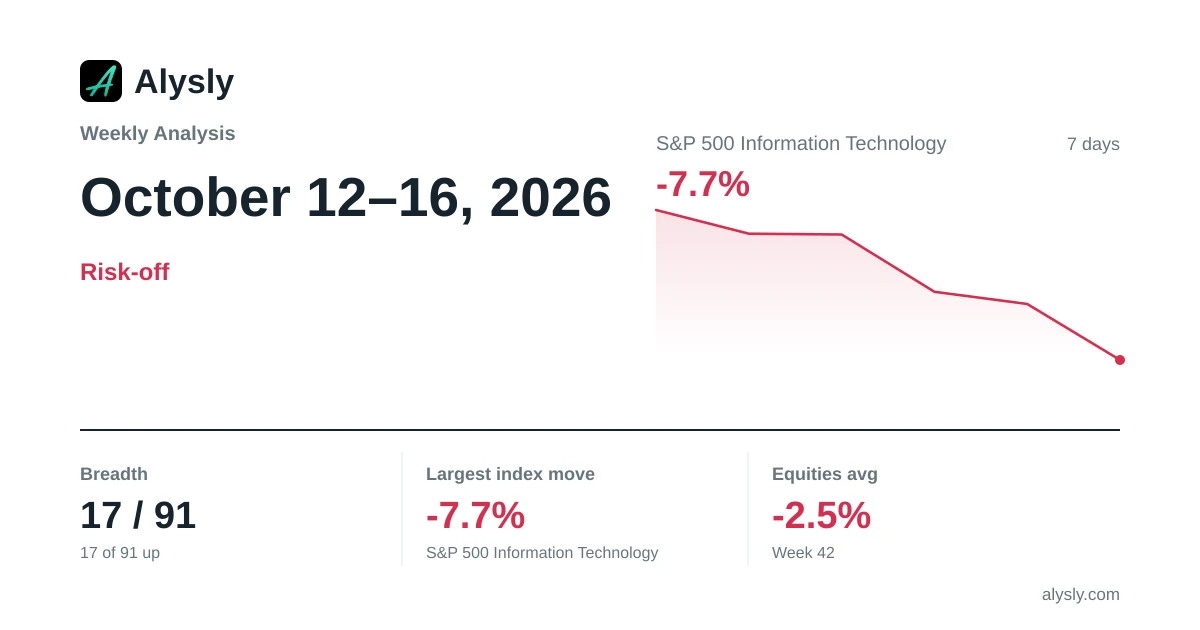
The trading week of October 12–16, 2026 in review: 17 of 91 tracked assets (19%) finished the week higher, with the major equity indices moving -2.5% on average over the week. The analysis sets the week against our own history, shows where the major markets stand and places real assets next to them.
What Stands Out
This section measures the week against our own price database, using a fixed rule stated below the list. This time it applies to 4 readings.
- Nasdaq 100: -5.5% for the week, its biggest weekly loss since the week ending April 4, 2025.
- Russell 2000: -3.0% for the week, its biggest weekly loss since the week ending March 6, 2026.
- MSCI Emerging Markets: -5.9% for the week, its biggest weekly loss since the week ending March 6, 2026.
- S&P 500 Information Technology: -7.7% for the week, its biggest weekly loss since the week ending April 4, 2025.
Rule: a benchmark index is listed when its weekly change (Friday to Friday) is its largest in that direction for at least 26 weeks. The count of new 52-week highs or lows appears when it is the highest of the last 13 weeks and at least 5. Based on closing prices in our own database.
Weekly Barometer
On average, commodities led at +3.0%, while crypto assets came last at -7.0%. 4 of 18 equity indices rose, as did 8 of 58 crypto assets.
Weekly change = last close of the week versus the last close of the week before. The ring counts all tracked indices, crypto assets, precious metals, commodities and currency pairs.
Where the Major Markets Stand
4 of 18 indices with a weekly price closed higher. The DAX had the largest weekly gain at +1.6%, the S&P 500 Information Technology the largest loss at -7.7%. The S&P 500 came in at -2.0%, the Euro STOXX 50 at -0.1% and the MSCI Emerging Markets at -5.9%.
In 32 of the 117 weeks before, the S&P 500 moved at least as much as it did this week (-2.0%), in either direction. Our own series starts on Jul 12, 2024.
| Index | Bar | Week |
|---|---|---|
| DAX | +1.6% | |
| MSCI Europe | +1.5% | |
| Dow Jones | +0.6% | |
| MSCI World ex USA | +0.2% | |
| MSCI EMU | -0.1% | |
| Nikkei 225 | -5.4% | |
| Nasdaq 100 | -5.5% | |
| MSCI EM IMI | -5.7% | |
| MSCI Emerging Markets | -5.9% | |
| S&P 500 Information Technology | -7.7% |
| Market | Week | 2026 | From 52-Week High |
|---|---|---|---|
| MSCI World | -1.3% | +11.1% | -2.4% (high of Aug 13, 2026) |
| S&P 500 | -2.0% | +11.9% | -2.0% (high of Oct 6, 2026) |
| DAX | +1.6% | -2.9% | -7.2% (high of Aug 28, 2026) |
| Gold | -0.8% | -3.7% | -21.9% (high of Jan 29, 2026) |
| Bitcoin | -2.6% | -6.9% | -28.8% (high of Oct 26, 2025) |
Distance from the 52-week high: the last close of the week against the highest close of the twelve months before. The frequency above describes the series so far and is not a probability for coming weeks. All of the week's figures are in the overviews for indices, stocks, crypto, commodities, precious metals and FX.
What Large Market Participants Reported
At 4 companies, at least three different executives, directors or major shareholders reported an open-market purchase in the 30 days to Friday. The trades reported over the past 30 days are listed in the markets overview. Such a cluster says nothing about where the price goes next.
Real Assets Next to the Markets
12 auction sales were recorded this week. The individual sales and their price range are on the real asset pages.
Real assets have no weekly prices, so the chart compares the change over twelve months. The range runs from +243.1% (Trading card price index) to -24.6% (Bitcoin). The reference dates differ and are shown next to each bar.
| Series | Bar | 12 months |
|---|---|---|
| Trading card price indexas of Sep 28, 2026 | +243.1% | |
| S&P 500as of Oct 16, 2026 | +15.5% | |
| MSCI Worldas of Oct 16, 2026 | +14.1% | |
| Euro area home pricesas of Jun 30, 2026 | +3.8% | |
| US home pricesas of Jul 1, 2026 | +2.3% | |
| German home pricesas of Jun 30, 2026 | +0.6% | |
| Goldas of Oct 16, 2026 | -2.9% | |
| Bitcoinas of Oct 16, 2026 | -24.6% |
Markets: price change up to the Friday of the week. Trading cards: our own price index built from auction records. Home prices: official price indices with a reporting lag. Watches and classic cars have no index and are therefore not in the chart.
Official Dates in the Following Week
- : US initial jobless claims
Only dates confirmed by an official source are listed: central bank rate decisions and US labor market reports. The economic calendar shows more.
Latest Investment Analysis
 · Mixed
Weekly Analysis: MSCI China Leads the Week (+2.6%) · October 5–9, 2026
 · Mixed
Weekly Analysis: Nikkei 225 Sets the Tone for the Week (+3.4%) · September 28 – October 2, 2026
 · Risk-on
Weekly Analysis: S&P 500 Information Technology Leads the Week (+3.5%) · September 21–25, 2026
 · Mixed
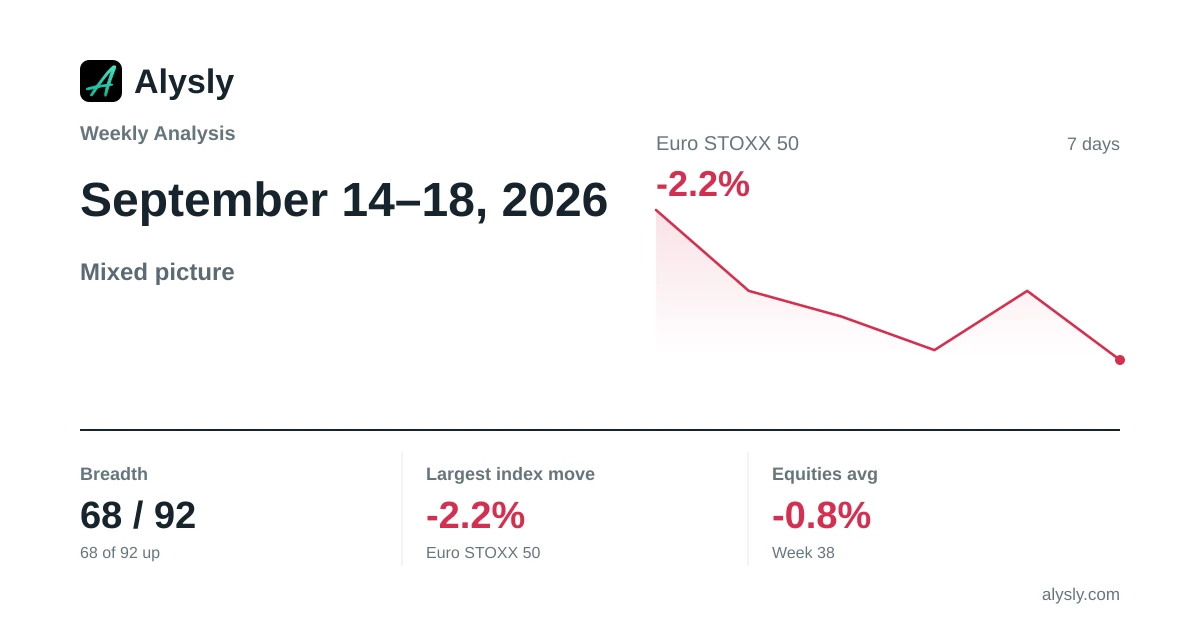
Weekly Analysis: Euro STOXX 50 Weighs on the Week (-2.2%) · September 14–18, 2026
 · Risk-off
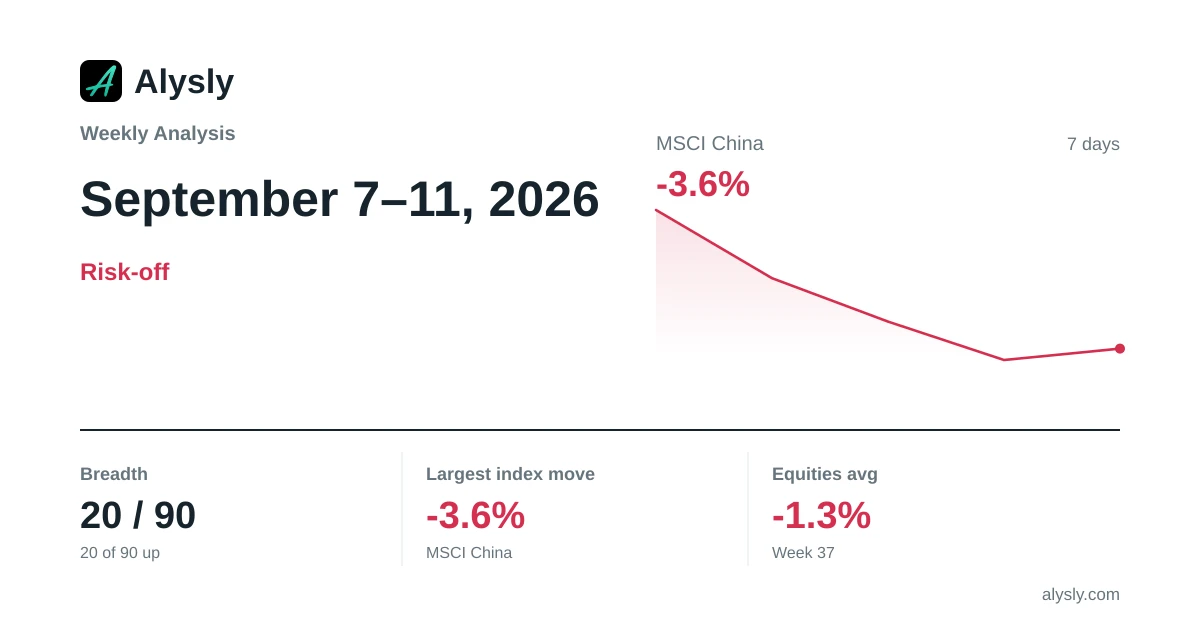
Weekly Analysis: MSCI China Lags the Week (-3.6%) · September 7–11, 2026