Level 3 AI in trading · Part 3/9
Data and Bars: The Sample Decides
Before a model can learn anything, the continuous stream of trades has to become a table of rows. That decision is almost always made without thinking about it, yet it matters more than the choice of model.
The problem with time intervals
The default is the time bar: one row per minute, hour or day. But markets do not trade evenly across time. The first trading hour holds many times the activity of the midday hour, and around a central bank decision more happens in minutes than otherwise happens in whole days.
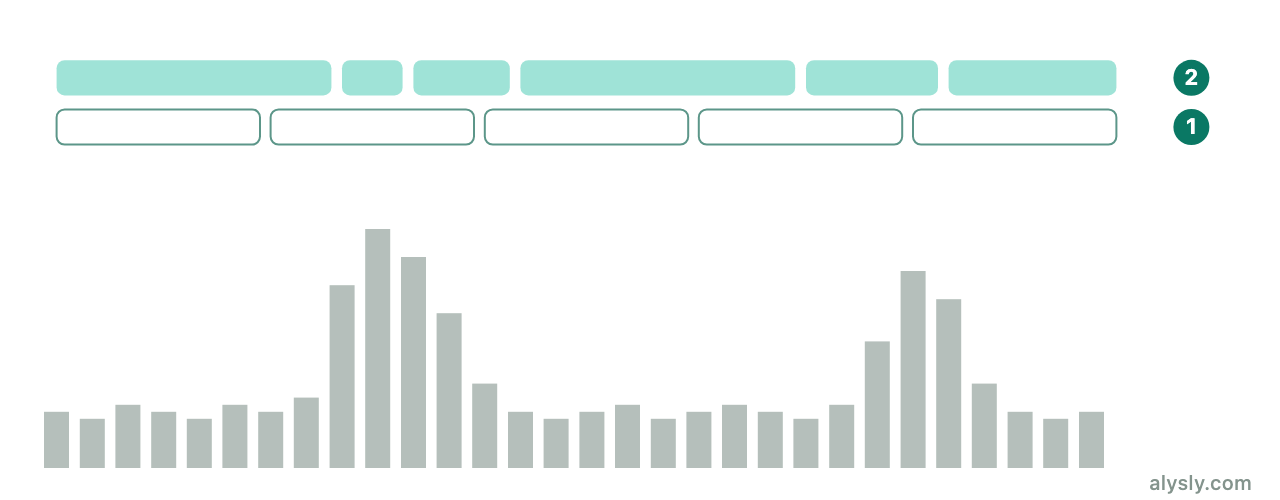
The result: quiet phases produce many almost empty observations, while hectic phases squeeze a great deal of information into a single row. For a model, the rows of the table are not comparable: some carry hardly any information, others too much.
This shows up in the statistics: returns from time bars are more skewed and have considerably fatter tails than returns from activity-based sampling.
The alternatives
Tick bars. A new row after every n trades. This evens out the number of events but ignores their size. Because much order flow is now split into small child orders, the count is easily distorted.
Volume bars. A new row after every n units traded. This is closer to economic activity than a plain count of trades.
Dollar bars. A new row after every n units of currency traded. The main advantage over volume bars: after a large price increase, the same number of shares represents far more capital. Over long horizons, and through buybacks or new issues, dollar bars therefore stay comparable the longest.
The effect is unspectacular and effective. The slices vary in length, but each one carries a comparable amount of information. Returns built from them sit closer to a normal distribution, which is exactly what almost every method further down the line assumes.
Event-based sampling
One step further: do not sample at regular intervals at all, but only when something has happened. A common criterion is cumulative movement crossing a threshold, known as a CUSUM filter. The model then only sees situations in which a decision would actually come up.
The side effect matters more than it sounds: the sample is smaller, but every row is relevant. Models trained on a hundred thousand rows of uneventful price action mostly learn to reproduce the normal state.
What this means in practice
For the pattern statistics of Level 2 there is an uncomfortable consequence. A study on daily bars does not measure the pattern; it measures the pattern plus the sampling decision. Two studies of the same pattern with different bar definitions cannot be compared.
Without tick data, which is the normal case, the awareness at least remains: daily bars are a convention from the era of printed price lists, not a natural unit of the market.
Next
The next hurdle: price series are not stationary, but models need stationarity without losing the memory of the series.