Level 3 AI in trading · Part 2/9
Why Machine Learning Fails in Markets
Machine learning works well in many fields because certain assumptions hold there. In financial markets those assumptions do not hold. If you apply the methods to price data unchanged, you reliably get models that look brilliant in hindsight and deliver nothing in production.
In its structure, this level follows the research literature on financial machine learning, in particular the work of Marcos López de Prado (Advances in Financial Machine Learning, the ORIE 5256 lecture series, and The 7 Reasons Most Machine Learning Funds Fail). The methods are explained here in our own words and with our own graphics.
The starting position
An image model works with independent examples, clean labels and a stable relationship: a cat stays a cat. Financial data offers none of that.
- Observations are not independent. Prices that follow each other are strongly correlated, and overlapping windows share the same information.
- The signal-to-noise ratio is extremely low. A good edge is a few percentage points better than chance, not 95 percent accuracy.
- The relationship changes. Whatever works gets traded, and that makes it disappear. This is not a data problem but the mechanism of the market.
- There is only one history. You cannot generate a second 2008. Every test runs on the same dataset everyone else uses.
The typical failure modes
The lone researcher. One person is supposed to source the data, build the features, train the models, run the backtests and trade the result. In any other quantitative discipline that would be unthinkable. The alternative is a division of labor along a production line – data curation, feature analysis, strategy construction, backtesting – in which nobody carries an idea alone all the way to deployment.
The backtest as a research tool. If you use the backtest to find a strategy instead of to check one, the result is worthless. Every iteration uses up test data. After a hundred runs the test period is completely spent, and nobody noticed.
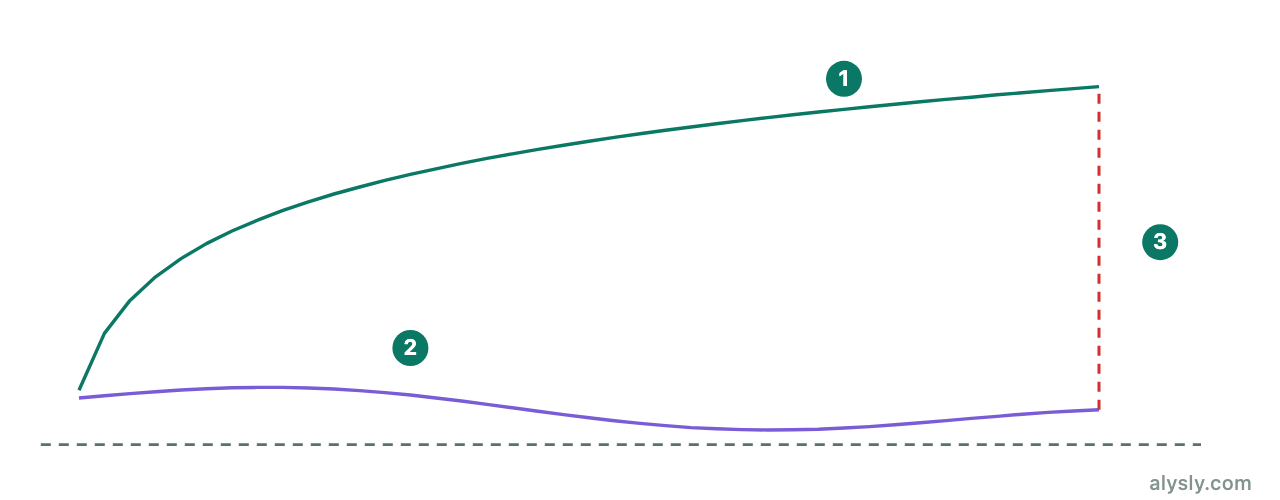
Splits that ignore chronology. Standard random cross-validation assumes independent observations. On price series it leaks future information into the training set. This is covered in detail under cross-validation .
Fixed time windows as a sample. One data point per hour treats a quiet night hour like the hour of a central bank decision. The resulting returns are strongly non-normal – see data and bars .
Bad labels. “Is the price higher in ten days?” ignores everything that happened in between. A path that dips far below any stop is a loss in practice and a win in the label.
Overlap that gets ignored. When a label reaches ten periods into the future, neighboring examples overlap by 90 percent. A model that treats them as independent mistakes repetition for confirmation.
An unreported number of trials. Testing twenty variants and reporting the best one means reporting a maximum. How badly that distorts the metrics is covered under backtest overfitting .
What this means for AI trading bots and apps
How AI trading systems are built, what bots and apps can be checked for, and what our own price data says about short-term trading is covered in AI trading: how it works and where it fails .
Trading bots and apps that advertise artificial intelligence run into the same problems as any research team, usually with less data and fewer checks. A strategy that looks profitable in a backtest may simply be the best of many variants that were tried, and it can fail as soon as real money trades it. Performance figures in advertising are rarely audited. Fees, spreads and slippage often decide whether a small edge survives at all.
Regulators have warned about this market. In January 2024 the US Commodity Futures Trading Commission (CFTC) published a customer advisory titled “AI Won’t Turn Trading Bots into Money Machines”. It describes schemes that promise high automated returns from AI and then disappear with customer deposits. A promised return says nothing about whether a bot or app is legitimate. What can be checked is registration with a financial supervisor, a track record that someone independent has verified, and clear information on costs. How high the hurdle is for any trading strategy, with or without AI, is measured in why most traders lose money .
What comes next
No single trick fixes all of this. Each of the remaining articles in this level takes one failure mode and the method that research developed against it:
| Problem | Method |
|---|---|
| Uneven information density | activity-based bars |
| Trend vs. stationarity | fractional differentiation |
| Unusable labels | triple barrier, meta-labeling |
| Overlapping examples | sample weights, uniqueness |
| Leakage during validation | purging and embargo |
| Too many trials | deflated Sharpe ratio, PBO |
One realistic expectation: none of these methods turns a bad result into a good one. They make it visible that the result is bad, before real money depends on it. That is the actual gain.
Next
We start with the foundation: how to turn a price series into a usable sample in the first place.