Level 3 AI in trading · Part 7/9
Cross-Validation Without Leakage
Cross-validation is the standard tool for checking whether a model generalizes. On financial data, in its usual form, it systematically returns results that are too good.
Why k-fold leaks
Standard k-fold cross-validation splits the data randomly into k blocks, trains on k−1 of them and tests on the rest. It assumes independence.
On price data that creates two leaks:
Through labels. A training example shortly before the test block has a label that reaches into the test block. Its outcome is driven by the same price moves as the test examples. The model has already seen part of the answer.
Through autocorrelation. Prices at neighboring points in time are similar. A model that knows Monday’s and Wednesday’s price can almost guess Tuesday without having learned anything economic.
The result is always the same: excellent validation scores and a disappointing live run.
Purging and embargo
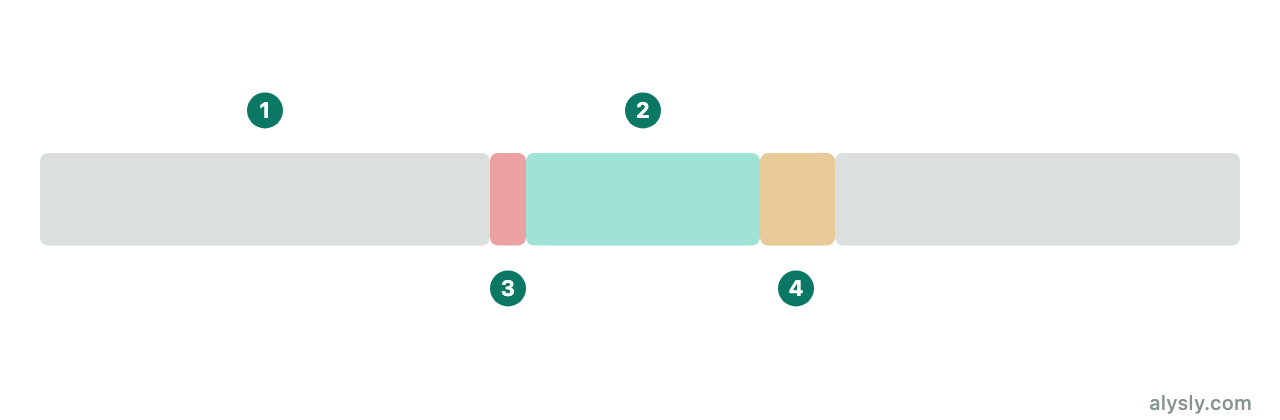
Purging removes from the training set every example whose label window overlaps the test window. That closes the leak through labels.
Embargo additionally blocks a short span directly after the test window. The reason is autocorrelation: examples right after the test still contain information about its end, even when their label windows do not formally overlap. A common size is one to five percent of the length of the data.
Together they cost training data – with ten blocks, easily a mid single-digit percentage. That loss is the price of having a metric that means anything at all.
Why a single test period is not enough
Even with purging, one problem remains: a single split gives you exactly one number. You cannot see from it whether the number is stable or whether it depends on a lucky cut point.
Combinatorial purged cross-validation deals with this. Instead of one test block, several blocks are used as test sets in different combinations. That produces many different train/test paths, and therefore a distribution of results instead of a single figure.
The benefit is the same as with the Monte Carlo tool for portfolios: you see the range of outcomes the same data could just as easily have produced. A strategy whose Sharpe ratio swings between 0.2 and 1.8 depending on the split is a very different thing from one that stays steady at 0.9, even when both average out to the same value.
What remains
Even a cleanly purged procedure only answers whether the model generalizes on this data. It does not answer whether the relationship still exists tomorrow, and it does not correct for the number of variants you tried.
That second question is the last and largest error – and the subject of the next article.
Next
How many attempts are hiding inside a good backtest?