S&P 500 Information Technology Index
The index holds the S&P 500 technology constituents – semiconductors, software and hardware – and is the most-used building block for dedicated US tech exposure.
The ten largest holdings make up 75.7% of the S&P 500 Informationstechnologie, out of 75 holdings in total; the largest sector is Information Technology at 99.8% (as of Oct 8, 2026).
Composition – 50 Largest Holdings
Based on: iShares S&P 500 Information Technology Sector UCITS ETF USD (Acc) · as of Oct 8, 2026 · 75 holdings
| # | Stock | Ticker | Sector | Country | Weight |
|---|---|---|---|---|---|
| 1 |  NVIDIA Corporation NVIDIA Corporation | NVDA | Information Technology | United States | 20.98% |
| 2 |  Apple Inc. Apple Inc. | AAPL | Information Technology | United States | 18.40% |
| 3 |  Microsoft Corporation Microsoft Corporation | MSFT | Information Technology | United States | 14.66% |
| 4 |  Broadcom Inc. Broadcom Inc. | AVGO | Information Technology | United States | 6.47% |
| 5 |  Micron Technology Inc. Micron Technology Inc. | MU | Information Technology | United States | 4.42% |
| 6 |  Advanced Micro Devices Inc. Advanced Micro Devices Inc. | AMD | Information Technology | United States | 3.83% |
| 7 |  Intel Corp. Intel Corp. | INTC | Information Technology | United States | 2.01% |
| 8 |  Palantir Technologies Inc. Class A Palantir Technologies Inc. Class A | PLTR | Information Technology | United States | 1.73% |
| 9 |  Cisco Systems Inc. Cisco Systems Inc. | CSCO | Information Technology | United States | 1.71% |
| 10 |  Applied Materials Inc. Applied Materials Inc. | AMAT | Information Technology | United States | 1.53% |
Show holdings 11 to 50
 Lam Research Corporation 1.51%
 Palo Alto Networks Inc. 1.23%
 CrowdStrike Holdings Inc. Class A 1.01%
 Texas Instruments Incorporated 0.99%
 KLA Corporation 0.97%
 Marvell Technology Inc. 0.91%
 Sandisk Corporation 0.89%
 Oracle Corporation 0.88%
 Arista Networks Inc 0.84%
 International Business Machines Corporation 0.81%
 Amphenol Corporation Class A 0.80%
 Analog Devices Inc. 0.75%
 QUALCOMM Incorporated 0.71%
 Salesforce Inc. 0.70%
 Seagate Technology Holdings plc 0.66%
 Dell Technologies Inc. Class C 0.65%
- ServiceNow Inc. 0.55%
 Western Digital Corporation 0.53%
 Accenture plc Class A 0.48%
 Corning Inc 0.46%
 Fortinet Inc. 0.44%
 Cadence Design Systems Inc. 0.36%
 Adobe Inc. 0.36%
 Synopsys Inc. 0.36%
 Hewlett Packard Enterprise Co. 0.36%
 Lumentum Holdings Inc. 0.35%
 Datadog Inc. Class A 0.35%
 Intuit Inc. 0.31%
 Motorola Solutions Inc. 0.28%
 Monolithic Power Systems Inc. 0.25%
 Keysight Technologies Inc 0.24%
 Teradyne Inc. 0.24%
- Te Connectivity plc 0.23%
- Ciena Corporation 0.23%
 Coherent Corp. 0.22%
 NXP Semiconductors NV 0.22%
 Everpure Inc. Class A 0.19%
- Autodesk Inc. 0.19%
 NetApp Inc. 0.17%
 FLEX Ltd. 0.16%
Sectors
Countries
Weighting Since 2019
Measured by iShares S&P 500 Information Technology Sector (QDVE), a fund tracking this index, the ten largest holdings accounted for 64.7% of the fund's total weight on Sep 30, 2019; on Oct 8, 2026 it was 75.9%. The effective number of holdings shows how many equally weighted positions the actual weights amount to: the more uneven the weights, the lower the number. It fell from 12 to 9 over this period, while the fund most recently held 75 actual positions.
| As of | Positions | Top 10 | Effective holdings |
|---|---|---|---|
| Dec 31, 2019 | 70 | 65.4% | 11 |
| Dec 31, 2020 | 73 | 67.5% | 10 |
| Dec 31, 2021 | 76 | 66.6% | 10 |
| Dec 30, 2022 | 76 | 66.8% | 10 |
| Dec 29, 2023 | 64 | 72.8% | 9 |
| Dec 31, 2024 | 69 | 76.1% | 8 |
| Dec 31, 2025 | 70 | 77.6% | 8 |
| Oct 8, 2026 | 75 | 75.9% | 9 |
S&P 500 Information Technology Price Chart
The chart shows daily closing prices and is set to the current year by default. The price is up 38.1% year to date and up 37.0% over twelve months. The last recorded close on October 9, 2026 was at 96% of the 52-week range.
Price series from our database since Aug 2, 2024, 549 daily values.
S&P 500 Information Technology Performance
| Year to date | +38.1% | 1 month | +5.8% |
|---|---|---|---|
| 3 months | +7.0% | 1 year | +37.0% |
| Calendar year 2025 | +23.8% |
S&P 500 Information Technology Index Funds and ETFs
ETFs Tracking This Index
- QDVE EU iShares S&P 500 Information Technology Sector UCITS ETF USD (Acc) · TER 0.15% cheapest
Next Events
Technical Analysis: S&P 500 Information Technology
Risk Metrics
Correlations (90 Trading Days)
| Instrument | r | −1 … +1 |
|---|---|---|
| Nasdaq 100 | +0.96 | |
| MSCI Emerging Markets | +0.89 | |
| MSCI EM IMI | +0.89 | |
| Altria Group Inc. | -0.64 | |
| Republic Services Inc. | -0.64 | |
| Waste Management Inc. | -0.63 |
The strongest co-movers are listed at the top, the strongest inverse movers at the bottom. Low or negative correlations can help spread risk more broadly across a portfolio.
Related Content: S&P 500 Information Technology
News About S&P 500 Informationstechnologie
 · Risk-on
Weekly Analysis: S&P 500 Information Technology Leads the Week (+3.5%) · September 21–25, 2026
 · Risk-on
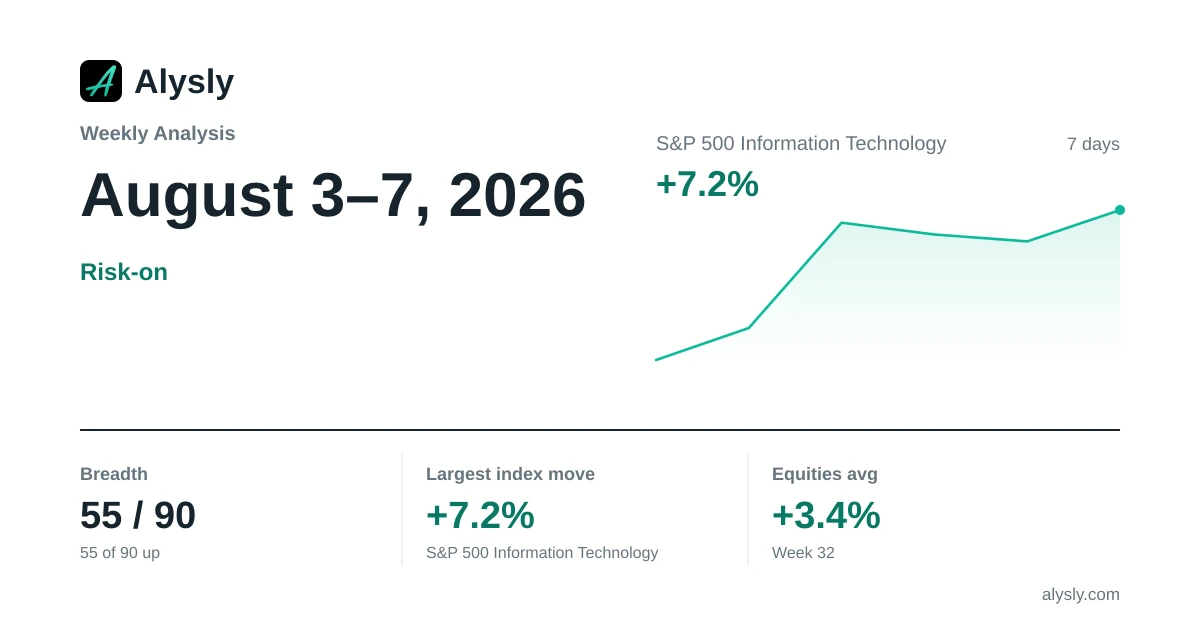
Weekly Analysis: S&P 500 Information Technology Sets the Tone for the Week (+7.2%) · August 3–7, 2026