Is the Pokémon Card Market a Bubble? 4,159 Sales Tell the Story
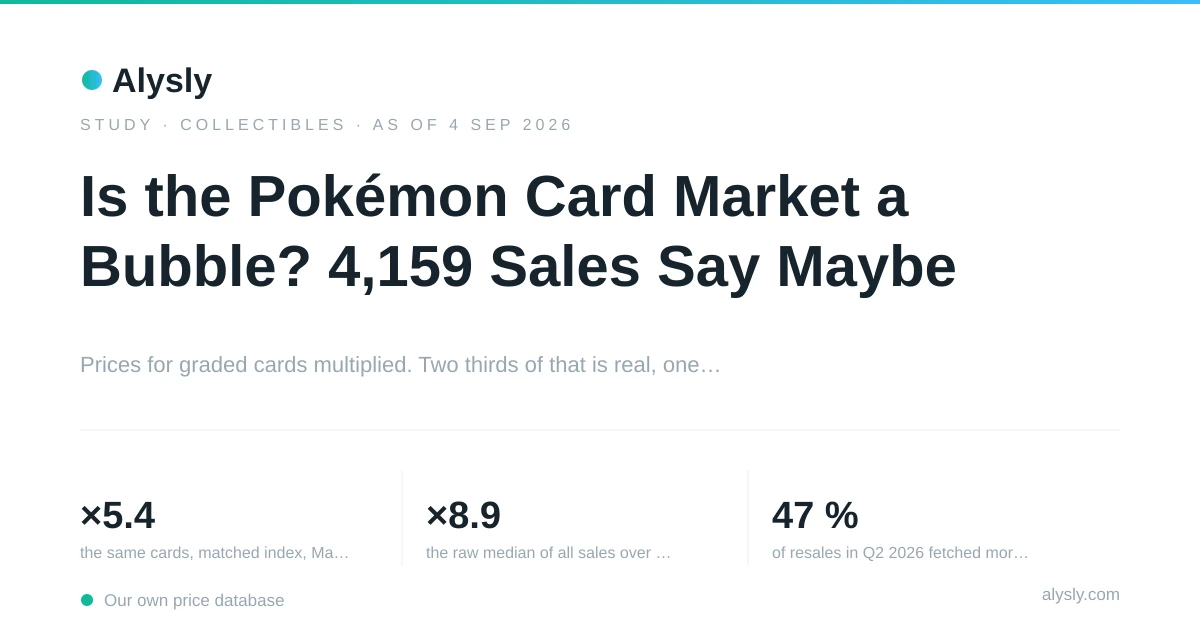
Between March 2022 and August 2026, the price of a PSA 10 Pokémon card increased several times over. But the size of that increase depends on how you measure it. The difference between the two measures is one of the most interesting findings in this study.
- ×5.4for the same cards, matched-model index, Mar 2022 – Aug 2026
- ×8.9for the raw median of all sales over the same period
- 47%of resales in Q2 2026 sold for more than twice the previous price
- 43%of resales in Q3 2026 sold below the previous price
Two Answers to the Same Question
Take every Pokémon card in our database and every auction price actually paid for a PSA 10 copy. Then ask a simple question: how much more expensive did these cards become between March 2022 and August 2026?
The first answer is easy to calculate. If we sort all 4,159 sales by quarter and take the median price for each quarter, the series rises from $528 to $4,680, a factor of 8.9.
The problem is that this calculation measures not only price changes, but also which cards happened to be sold in each quarter. If more expensive cards were sold later in the period than at the beginning, the median rises even if individual cards did not gain nearly as much.
That is why we also look only at cards that were sold more than once. The question is no longer which cards were sold. It is what happened to the price of the same card.
The result is lower, but still very large: the matched-model index rises from 100 to 538, or 5.4 times the starting level.
Loading figure …
Both lines use the same market and the same sales, so the gap between them is very revealing. Measured on the same cards, prices rose 438%. The raw median shows 786%. About 350 of those percentage points come from a change in the mix: more expensive cards were sold in later quarters than in early ones.
In addition, we checked the matched-model index in two different ways. An independently calculated, equally weighted average of price changes by card reaches 450 index points instead of 538. Removing the 42 most frequently traded cards gives an index of 548. The numbers are not identical, but both checks point to the same general result.
The Boom Came Late
The timing of the increase is just as important as its size.
During the first three years, very little happened. The index stood at 100 in March 2022 and at 94 in December 2024. It even fell to 80 in early 2024. Someone who bought an average card in 2022 and sold it in late 2024 would have taken a loss, even before fees.
Then the market changed quickly.
From 94 in December 2024, the index rose to 116, then 153, 185 and 265. By March 2026 it had reached 456, and by the end of June it was already at 551. That is a gain of 485% in eighteen months.
Almost the entire increase therefore happened in just six quarters. That is very different from a market that rises steadily over several years.
In the following quarter, which is still incomplete, the index falls back to 538.
Which Bubble Signals Can We Measure?
A sharp price increase alone does not prove that a market is in a bubble. A better approach is to look for patterns that often show up in speculative periods.
Our resale data let us measure three of them directly: acceleration, wider dispersion and a growing number of extreme price increases.
Loading figure …
Acceleration
At the end of 2024, the median gain between two sales of the same card was only 3.9%. In Q1 2025 it jumped to 33%, followed by 37%, 42% and 63%. By Q1 2026, it had reached 96%.
Rising prices are not unusual by themselves. What stands out here is that the gains themselves became larger from quarter to quarter.
Prices Became More Uneven
The spread of resale returns also increased. The standard deviation rose from 0.34 in early 2025 to 0.73 in Q2 2026.
In simple terms, cards of the same grade produced more and more different results from one resale to the next.
More Cards Doubled in Price
The number of extreme gains is even more striking. At the end of 2024, 6.7% of resales brought more than twice the previous price. By Q2 2026, that share had reached 47.1%. Almost one in two resales more than doubled.
There is, however, a fourth question that our data cannot answer. Was the price increase driven by new money looking for quick gains, or by collectors who want to keep the cards? That would require information about buyers and their motives.
The Most Expensive Cards Rose the Fastest
Another pattern is clear: cards that started at higher prices also had stronger gains later.
To test this, we divided the cards into three groups based on their first recorded sale price and calculated a separate index for each group. The first price matters because using the current price would let the later price increase decide which group a card lands in.
Loading figure …
The lowest-priced third, with a first price between $35 and $420, reaches 388 index points. The middle third, $432 to $1,140, reaches 602, while the highest-priced third, above $1,170, reaches 645.
Higher-priced cards therefore did better than lower-priced cards. But the difference is not large enough to say that the boom was driven by a small number of trophy cards. The price increase was spread across a much wider part of the market.
How Does This Compare With Other Investments?
A 5.4x increase sounds impressive, but it means little without a benchmark.
We therefore compare the card index with the S&P 500, gold, Bitcoin and US residential real estate, each over exactly the same window. The windows are not always identical, because our data does not start on the same date for every asset.
Loading figure …
| Asset | Period | Asset per year | Cards per year |
|---|---|---|---|
| S&P 500 | Mar 2022 – Aug 2026 | +12.6% | +46.3% |
| Gold | Jan 2023 – Aug 2026 | +27.9% | +63.1% |
| Bitcoin | Mar 2022 – Aug 2026 | +12.0% | +46.3% |
| US residential real estate | Apr 2022 – Jul 2026 | +2.7% | +50.6% |
Over the full window from March 2022, the card index returned 46.3% a year, compared with 12.6% for the S&P 500 and 12.0% for Bitcoin over the same days.
That is only part of the story, though. A high return says nothing about how stable the price path was, and the large differences between individual resales show how uneven this market became. These are also past returns from a single auction venue, before seller fees, grading, shipping and storage.
What the Last Quarter Shows — and What It Does Not
For the first time in a while, several measures are moving in a different direction.
The matched-model index falls from 551 to 538. At the same time, the median resale gain drops from 91% to 2.3%, while the share of resales below the previous price rises from 14.6% to 42.8%, the highest since 2024. Only dispersion stays high, at 0.71.
That is a clear change from the pattern of the previous quarters.
There is an important limitation, however: the latest quarter is not complete. The most recent recorded sale is from August 28, not September 30, and the figures rest on 194 resale pairs.
That is enough to show a clear slowdown. It is not enough to say that a lasting reversal has already begun.
The overall picture is therefore mixed. Prices for PSA 10 cards increased about fivefold over four and a half years, with almost all of the move in the last six quarters. Resale gains accelerated, price dispersion increased, and almost half of all resales in Q2 2026 more than doubled the previous price.
In the latest quarter, the gains and the share of doublings fell sharply, while prices stayed as uneven as before.
Whether this becomes a correction or just a pause can only be answered with more data. That is also the limit of what this study can show.
Data and Method
- Data basis
- 4,159 prices actually paid at auction across 420 cards, all in grade PSA 10, all in USD, from Feb 28, 2022 to Aug 28, 2026. Prices include the buyer’s premium.
- Method
- A matched-model index following Bailey/Muth/Nourse — the method behind Case-Shiller — applied to 2,165 resale pairs from 420 cards across 19 quarters. Only the price change of the SAME card between two sales enters it; the thinnest period rests on 40 pairs.
- Cross-check
- An independently calculated, equally weighted mean of the price change per card gives 450 index points instead of 538 — the same order of magnitude. The raw quarterly median stands at 886 and therefore overstates the move badly. Excluding the 42 most heavily traded cards leaves the index at 548.
- Only cards with at least two sales are included.
- Two sales must be at least 30 days apart and fall in different quarters, and the price ratio between them must be below 20. These filters come from the module the site uses for its collectible pages, so this study and those pages use the same method. Their levels can differ slightly, because the pages also include later sales, and every new resale pair revises earlier quarters a little.
- Frequently traded cards receive more weight because they produce more resale pairs. Removing the 42 most traded cards leaves the index at 548 instead of 538, so the result does not rest on them.
- Every price is the total paid at auction, meaning the hammer price plus the buyer’s premium. Seller commission, grading, shipping, insurance and storage are not included.
- All prices come from a single auction archive. The index therefore represents this marketplace, not the entire Pokémon card market. Private sales, dealer inventory and fixed-price listings are not included.
- The latest quarter ends with the most recent sale on August 28, 2026, and is therefore incomplete. Its 194 resale pairs are enough to read a direction, not enough to call a turning point.
- The study counts only sales that were on file on September 4, 2026. Lots the archive reported later stay out, so running the script again gives the same numbers.
- The grade is kept constant at PSA 10 throughout the period. Two copies of the same card are not identical, but they are treated as comparable objects for this analysis.
Every figure comes from our own price database and is produced by a script in the repository. Running it again with the same cutoff date returns the same numbers. Not investment advice.