Is the MSCI World Too American? The Real Numbers
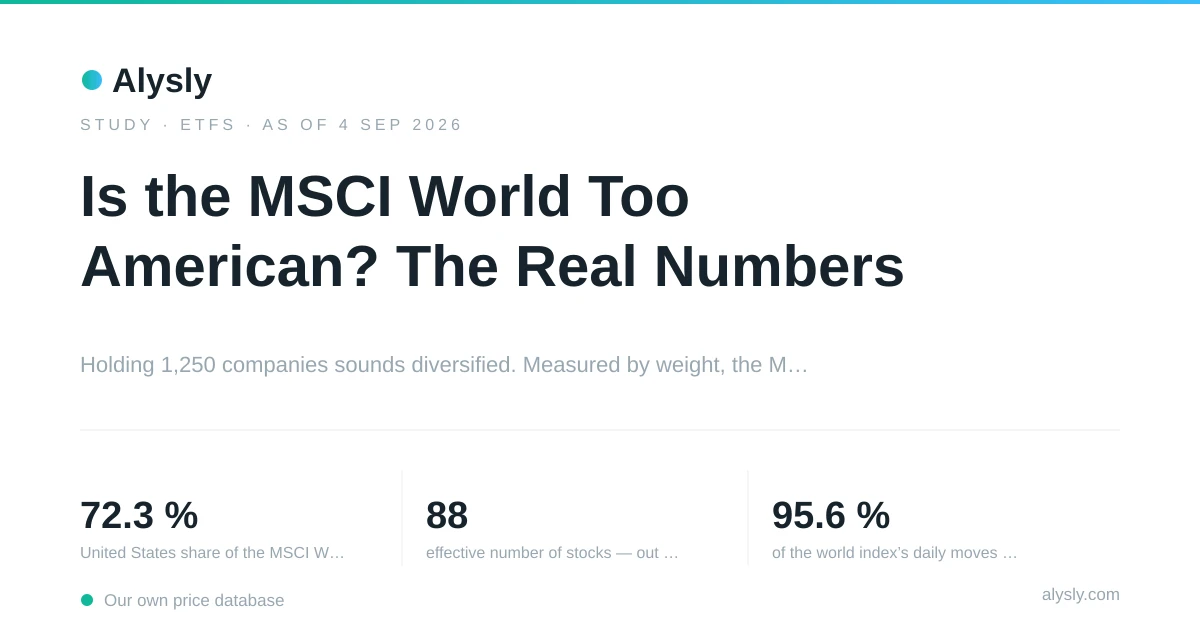
The MSCI World holds about 1,250 companies from 23 countries, yet roughly three quarters of its money is invested in just one of them. Whether that is a problem is often debated in broad terms. The fund’s own holdings and daily returns give a more precise answer, and the picture is more nuanced than the debate suggests.
- 73.0%United States share of the MSCI World
- 85effective number of stocks, out of 1,248 holdings
- 95.6%R² with the S&P 500 in daily returns
- 63.1%US share in September 2019
Two Ways to Count a World Index
A fund holding about 1,250 companies across 23 countries sounds highly diversified. But simply counting positions tells you very little about how a portfolio is actually distributed. A position of 0.01% and one of 5.8% both count as a single holding.
Weighting the positions gives a very different picture. In the largest MSCI World ETF, 73.0% of the fund is invested in US companies, while 27.7% sits in the ten largest positions. The largest single holding, NVIDIA, accounts for 5.78% of the entire fund. That is almost as much as all Japanese companies together, the second-largest country, and more than any other country in the index.
Loading figure …
The comparison across index families makes the difference clearer. The ACWI, which also includes emerging markets, has a 64.5% US share. World Small Cap, often used to broaden exposure, is still 61.0% invested in US companies. Emerging Markets, meanwhile, has 39.0% in its ten largest positions, with Taiwan Semiconductor alone at 15.6%. On this measure, it is much more concentrated than the MSCI World.
The Number That Describes It Best
One measure turns portfolio weights into an intuitive figure: the effective number of stocks. It asks how many equally weighted positions would produce the same level of concentration as the actual portfolio.
Loading figure …
For the MSCI World, the answer is 85, compared with 1,248 actual holdings. The other companies are still part of the fund, but their combined weight has much less influence on the portfolio than the holdings count suggests.
ACWI has 2,244 holdings and an effective number of 101. World ex USA has 734 holdings but an effective number of 222, making it the least concentrated of these large-cap indexes. Without the large US companies, the weights are spread much more evenly. World Small Cap has 3,675 holdings and an effective number of 1,600, which shows what broad diversification looks like when measured by weight.
So the more precise statement is not that the MSCI World is undiversified. It is that its effective diversification is roughly fifteen times lower than its holdings count suggests, with much of that gap coming from the largest US companies.
What the Concentration Does in Practice
Weights describe the portfolio. The more practical question is how the index behaves: does it move like a global portfolio, or mostly like the US market? Daily returns provide a direct way to test that.
Over 524 shared trading days, the correlation between the world index and the S&P 500 was 0.978. A regression of the world index on the S&P 500 produced a beta of 0.91 and an R² of 95.6%. In other words, the two indexes had very similar day-to-day movements over this period, with the MSCI World moving slightly less. The correlation with developed markets outside the US was lower, at 0.859.
The cumulative returns tell a similar story. Over the same period, the world index returned 49.1%, compared with 48.9% for the S&P 500 and 43.9% for developed markets outside the US. Over those two years, holders of the MSCI World and holders of the S&P 500 saw nearly the same performance, with a difference of 0.2 percentage points.
That is the more useful way to think about the concentration issue. The MSCI World is not simply a US index: it has broader exposure and moved slightly less than the S&P 500 over this period. But in these two years it did not behave very differently from the US market either. Most of its weight, and most of its daily movement, came from the US.
How Much Would a Shock Actually Cost?
A simple calculation helps put the concentration into perspective. It shows both how limited the risk of individual companies is and how much a broad US decline would matter.
Loading figure …
If the ten largest positions fell 20% while everything else stayed unchanged, the index would lose 5.5%. If the entire US block fell 20%, the index would lose 14.6%. A 30% decline across the US block would reduce the index by 21.9%, and a 50% decline by 36.5%.
The first calculation puts the risk of the largest individual companies into perspective: even a 20% decline across the ten biggest positions would have a single-digit effect on the overall index. The second shows the broader concentration issue. A US-specific shock would hit the index hard, because the rest of the portfolio is not large enough to offset it.
Sector weights point in the same direction. Information technology accounts for 31.5% of the fund, followed by financials at 15.9% and industrials at 10.9%. The concentration is therefore not only geographic.
How the US Share Has Grown Since 2019
For the largest MSCI World ETF, we hold month-end holdings lists going back to September 2019. They show that today’s concentration built up over several years.
In September 2019, US companies made up 63.1% of the fund. By September 2026, the share was 73.0%. The rise was not steady: the share dipped in early 2023 and again in early 2026, but each dip was smaller than the rise before it.
The effective number of stocks moved even more. It fell from 269 in September 2019 to 85 today, while the number of holdings dropped from 1,644 to 1,248. Measured by weight, the fund today is about three times as concentrated as it was seven years ago.
These figures describe one ETF over one period, and that period included a strong run in large US technology stocks. They show how the weights developed, not where they are heading.
So Is the Risk Real?
Three findings stand out, and they point in different directions.
The MSCI World is clearly diversified in terms of the number of companies it holds. Its effective number of 85 is higher than that of the US index at 46 and much higher than Emerging Markets at 27. Among these widely followed indexes, the World sits in the middle rather than at the most concentrated end.
At the same time, it is heavily exposed to the US, and more so than a few years ago. 73.0% of its weight sits in one country, up from 63.1% in 2019. Against the S&P 500, its daily returns show an R² of 95.6% over the period studied, and its two-year return was only 0.2 percentage points away. The index has behaved much more like the US market than the name “World” suggests.
The risk from a few individual technology companies is more limited. A 20% decline across the ten largest positions would reduce the index by 5.5%. A broad decline across US companies would have a much larger effect. The concentration risk is therefore more about the country than about any single company.
What this analysis cannot tell us is where the US share is heading. Seven years of holdings show a clear rise, but they do not say whether it will continue, stop or reverse.
Data and Method
- Weights come from the published holdings of the largest ETF tracking each index in our own fund database, rather than directly from the index provider. An ETF tracks its index closely but not perfectly, so individual weights can differ from the official index by a few tenths of a percentage point.
- The country assigned to each holding is taken from the fund’s own holdings file. The World ex USA fund, for example, still shows 0.4% in the United States, which shows the scale of the country-classification noise in the data.
- The effective number of stocks is 10,000 divided by the Herfindahl index of the portfolio weights. It answers a simple question: how many equally weighted positions would create the same level of concentration? It describes the portfolio structure; it is not a forecast.
- All holdings lists are the last ones on file up to September 30, 2026: the MSCI World fund is dated September 29, the other five funds September 30. Month-end lists are kept permanently, so a rerun gives the same numbers.
- The history covers only the MSCI World fund, with 85 month-end lists from September 2019 to September 2026. For the other funds we hold no older lists, so the comparison across index families is a current snapshot.
- Weights are normalized to the total value of the holdings actually listed, which ranges from 99.4% to 100% across the funds. The remainder is cash and futures positions held for liquidity.
- The daily-return comparison uses the world index ETF and the S&P 500 ETF over 524 shared trading days from August 5, 2024 to September 4, 2026, starting at the earliest common date for these series.
Every figure comes from our own price database and is produced by a script in the repository. Running it again with the same cutoff date returns the same numbers. Not investment advice.