Level 1 Reading charts · Part 3/7
Trend, Trendline, Channel
Few terms in technical analysis are used as loosely as “trend”, and few are defined as rarely. Yet the definition is precise, and you can test it.
The definition
An uptrend exists when each swing high sits above the previous one and each swing low does the same. A downtrend is the mirror image: lower highs, lower lows. Everything else is a sideways phase – and that is the normal state of a market, not the exception.
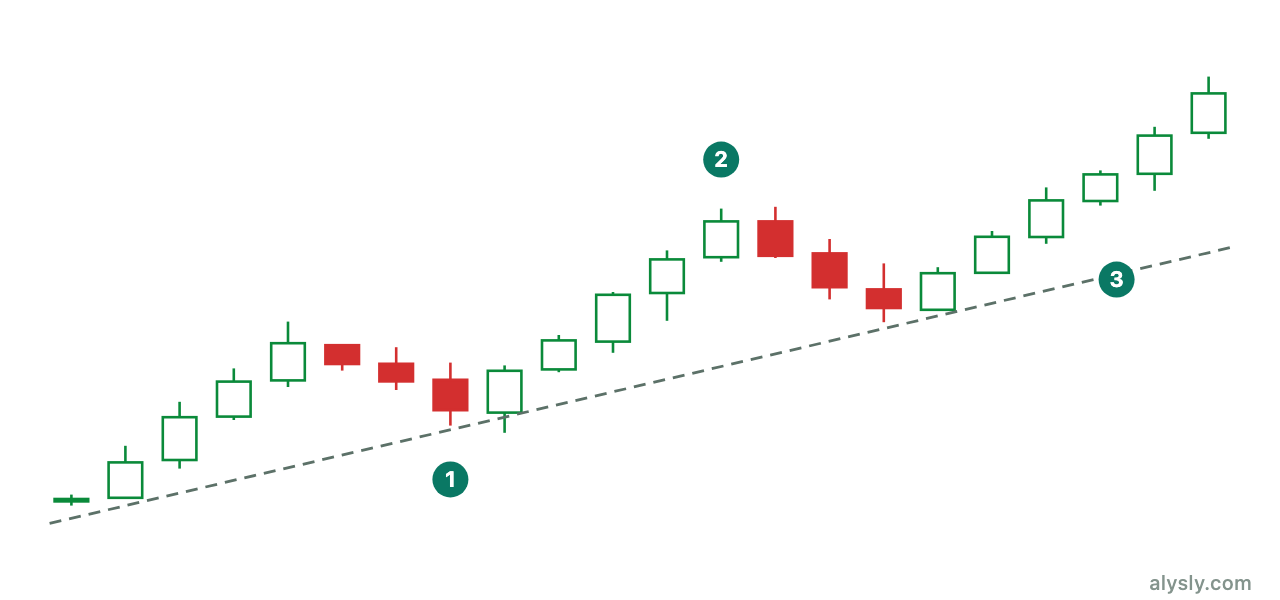
The value of this definition is that it can be proven wrong. “The trend is intact” is not an opinion. It is a statement that a single lower low ends. Saying “it is going up” because the price rose says nothing that could ever turn out to be false.
The trendline
A trendline connects the lows in an uptrend and the highs in a downtrend. It makes the slope visible and gives you a level whose break you can observe.
Three points matter:
- Any two points define a line. Only the third touch turns the line into a statement about the market instead of a statement about the two points you picked.
- The line holds nothing up. It describes; it does not act. Prices do not rise because a line is there.
- The scale changes it. The same prices produce lines with different slopes on a linear and on a logarithmic scale, and therefore different break points. Switching the scale until the line fits is curve fitting.
The channel
When a trend runs at a steady pace, you can draw a second line parallel to the first one on the opposite side. The space between the two lines is the channel.
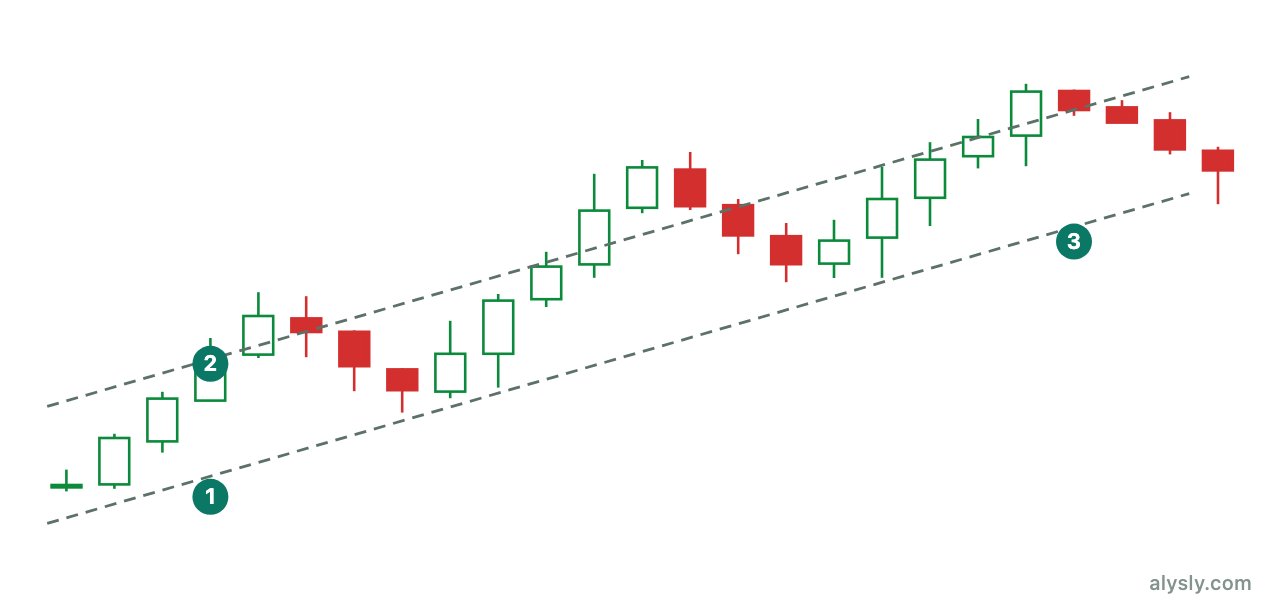
What tells you something is not the channel itself, but whether the price still fills it. When a rally no longer reaches the upper boundary, the trend is losing strength long before the lower line breaks. This is one of the few classic chart observations that signals a change instead of confirming one.
Trends per timeframe
Trends exist in several timeframes at the same time, and they contradict each other regularly. A weekly uptrend can contain a daily downtrend, which in turn consists of hourly rallies.
That is not a contradiction but a requirement: the timeframe you use to judge the trend has to match your intended holding period, and you have to fix it in advance. If you switch levels until the picture suits your position, you will always find confirmation – which is exactly why it is worthless.
Origin: Dow theory
The idea that markets move in trends, and that a trend needs confirmation from the breadth of the market, goes back to Charles Dow around 1900. Two of his core ideas still hold. First, a trend counts as intact until something disproves it. Second, a move is more credible when many instruments take part than when only a few do.
That breadth can be measured, and not only in stocks. The Altcoin Season Index , for example, answers exactly this question for the crypto market: is the move broad, or is it only the largest asset?
Next
Where trends turn and pause, you usually find price areas that come up again and again. That is the subject of the next article.