Level 1 Reading charts · Part 2/7
Reading Candles: Body, Wick, Color
The candle is the most common way to show prices, because it packs four numbers into a shape you can read in a fraction of a second. Its construction is simple. The interesting part is what the proportions tell you.
Construction
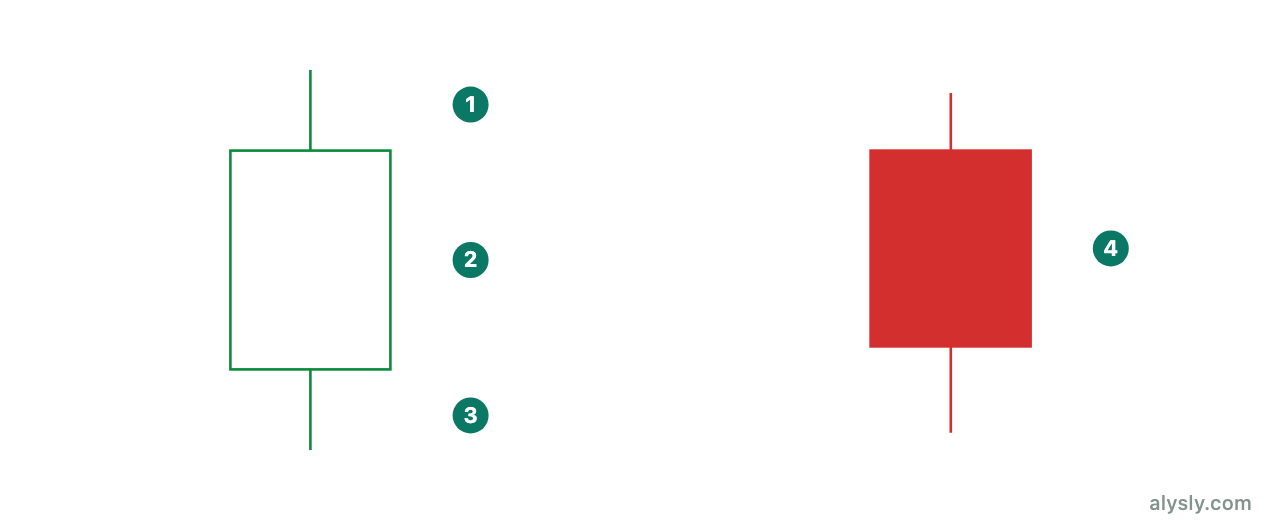
The body covers the distance from open to close. If the close is higher, the candle counts as up and is drawn hollow or green. If it is lower, the candle counts as down and is drawn filled or red. The wicks, also called shadows, reach up to the high and down to the low of the period.
Colors are pure convention. Japanese candles were originally white and black, and many professional platforms still draw them that way. The color adds no information that the position of open and close does not already give you.
The proportions carry the message
The real information in a candle is the ratio of body to total range:
- Long body, short wicks: price moved in one direction and stayed there. Most participants agreed.
- Short body, long wicks: a lot of movement, no result. Both sides pushed the price around, and neither could hold it.
- One long wick on a single side: the market reached a price area and rejected it. That is where the information sits, not in the color.
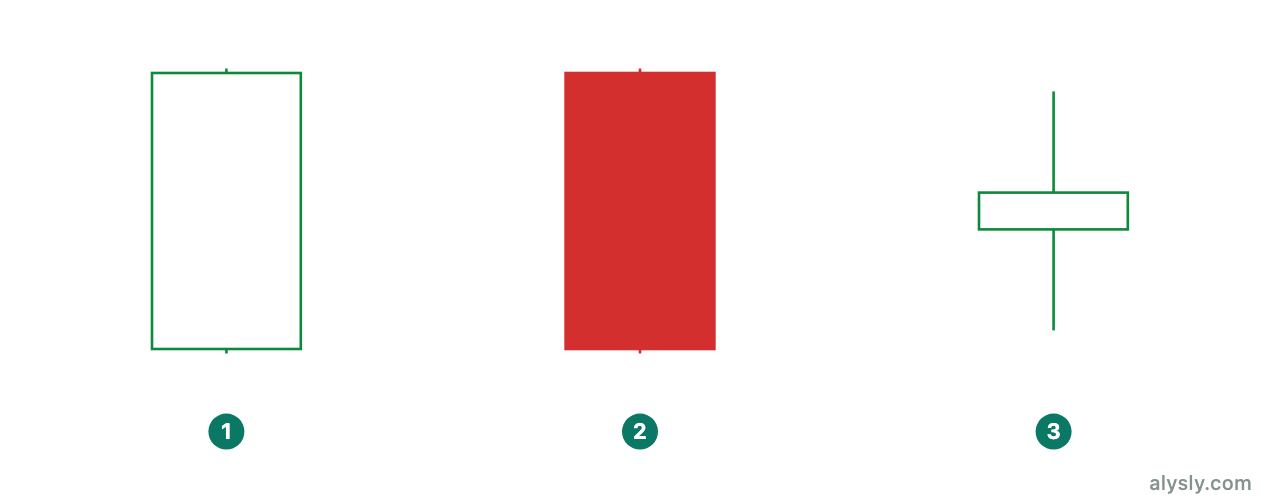
These three basic shapes carry Japanese names – marubozu, spinning top, doji – but the names are secondary. If you can read the ratio, you do not need the vocabulary.
Size is relative
There is no absolute definition of a “large” candle. A range of two percent is an exceptional day for a quiet bond ETF and an ordinary Tuesday for a cryptocurrency. What counts is the comparison with the last ten to twenty candles of the same instrument. That is exactly what average true range later turns into a number.
Gaps
Between one close and the next open there can be a gap: trading starts again at a different price from where it stopped. Gaps appear wherever trading is interrupted – overnight, over a weekend, or around an earnings report.
Where trading never stops, gaps are rare. Crypto trades around the clock, and the major currency pairs trade five days a week without a break. A pattern that needs a gap is therefore structurally rare in those markets. This is good evidence that candlestick patterns are not universal laws, but depend on how a market works.
What every candle destroys
A candle does not tell you the order in which the prices occurred. A day that rises to its high and then collapses to its low can produce exactly the same candle as a day that first breaks down and then recovers. In economic terms these are two completely different days.
This is why changing the timeframe is not cosmetic. It is the only way to get that information back: one daily candle breaks down into 24 hourly candles that show the sequence. If you take a candlestick pattern seriously, you should at least know what happened one level below it.
Next
Reversal and continuation patterns made of several candles are covered in Level 2 . Before that, one piece of context is still missing, and without it every reversal pattern is meaningless: the trend.