Level 2 Patterns & indicators · Part 8/9
Measuring Volatility: Bollinger and ATR
Volatility is the one quantity in technical analysis that can be forecast reliably. Not its direction, but its persistence: quiet phases follow quiet phases, and active ones follow active ones. This clustering is one of the most robust findings in financial research.
Bollinger bands
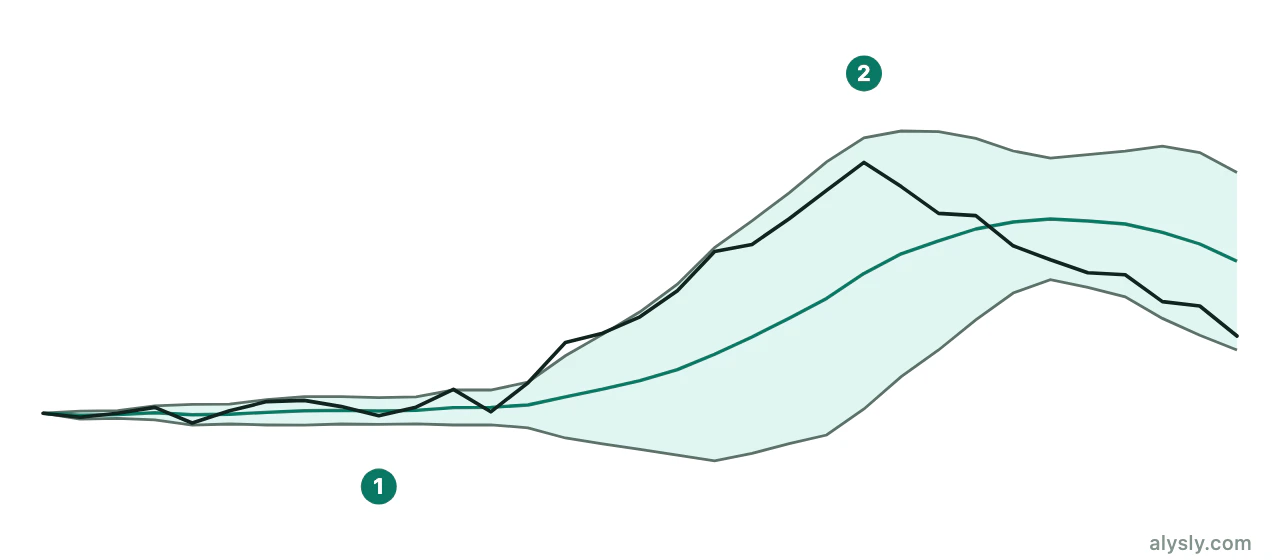
A moving average, usually over 20 periods, plus and minus two standard deviations. The width of the bands is the volatility.
The most common misuse is the same as with the RSI: a price at the upper band is read as expensive. It is not. In strong trends the price rides along the band. That is the definition of a strong trend, not a reason to sell.
The usable application is the squeeze: when the bands contract unusually tightly, an expansion follows with raised probability. What the squeeze does not tell you is the direction – and that is exactly where most descriptions stop.
Average true range
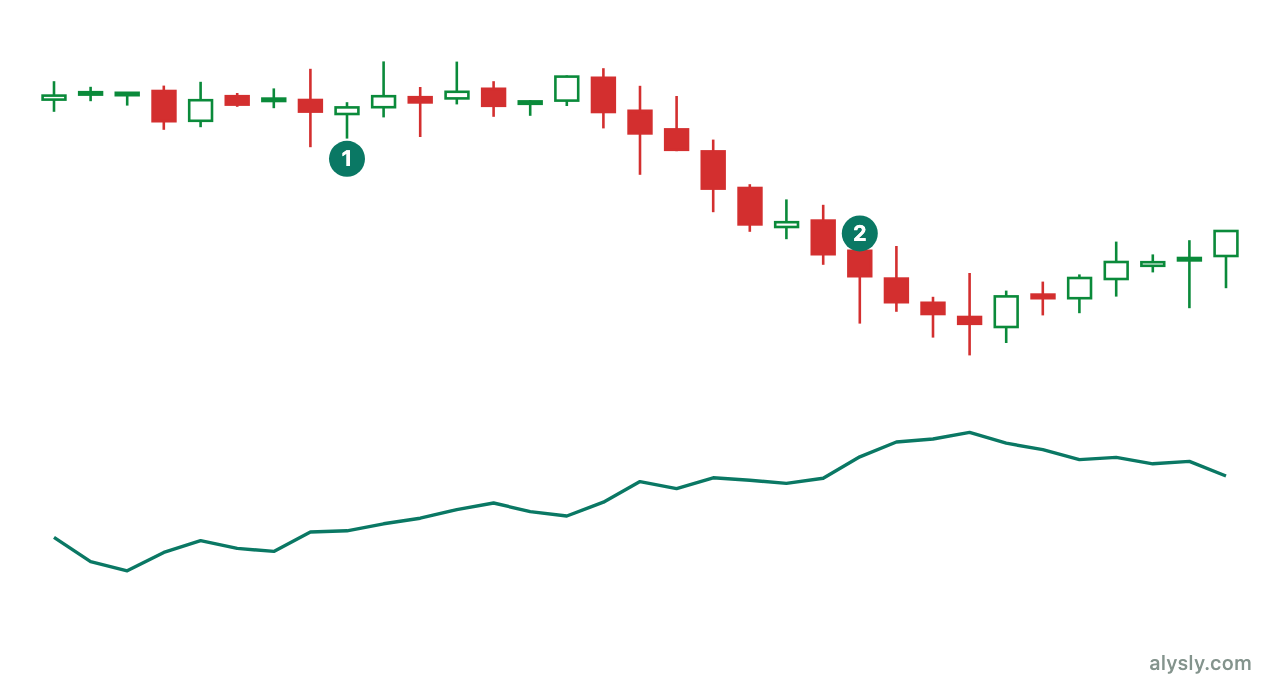
The true range of a period is the largest of three distances: high minus low, high minus previous close, and previous close minus low. That last part matters, because it accounts for gaps, which a plain high-minus-low range would ignore. ATR is the average of those values over n periods, by convention 14.
ATR is not a statement about direction and not a signal. Its value lies in two practical uses:
Stops in ATR units. A stop “2 percent below entry” gives plenty of room when volatility is low and almost none when it is high. A stop “two ATR below entry” keeps the distance constant relative to the movement that actually occurs – across instruments and across market regimes.
Position size. Once the stop is expressed in ATR units, the position size follows directly from the risk formula : risk in currency divided by (ATR × factor). More volatile instruments automatically get smaller positions, so the risk per position stays constant instead of moving with the temperament of the instrument.
That second use is probably the single most practical building block in this level.
Keltner channels
Similar to Bollinger bands, but built around ATR instead of standard deviation. The difference is not cosmetic: standard deviation reacts strongly to single outliers, while ATR reacts more evenly. For stop logic the ATR version is usually the steadier one.
Why volatility is the more dependable quantity
The direction of prices can hardly be forecast. That is the core of the criticism of technical analysis. Volatility can be forecast in part, because it is strongly autocorrelated.
This is exactly why the practical value of this chapter lies in risk management rather than in signals. You cannot know where the price is going, but you can estimate reasonably well how far it will move over the next week. Turning that estimate into stops and position sizes uses the most reliable part of the entire toolbox.
Next
The last article of this level: how to test a pattern or an indicator in the first place.