Level 1 Reading charts · Part 6/7
Risk, Stops and Position Sizing
This article covers the one part of technical analysis whose effect is mathematically settled. Everything else in this course is interpretation. Position sizing is arithmetic.
Thinking in R
The distance between entry and stop is one unit of risk – one R. Every result is measured in that unit. A trade that returns twice the risk is a +2R trade, whether that was 40 or 4,000 in currency.
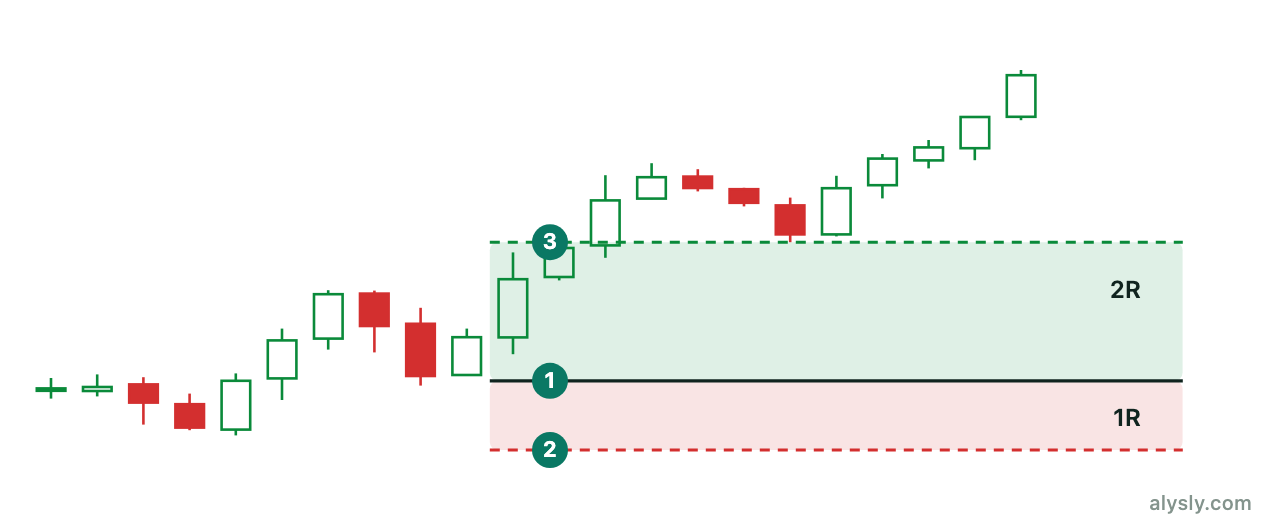
The benefit is comparability. Trades in different instruments, at different price levels and in different position sizes turn into a single series of numbers. From that series you can read the hit rate and the average result, and no single large winner dominates the statistics.
The stop determines the position size
The order of the steps is decisive, and most people run it backwards. The correct sequence is:
- Fix the risk per trade as a share of the account. A common range is 0.5 to 2 percent.
- Take the stop distance from the chart – the point where the idea is wrong, not the point where your preferred loss would be reached.
- Calculate the position size: risk in currency divided by the stop distance per unit.
An example: an account of 20,000 and 1 percent risk gives 200. Entry at 50, stop at 46, so the distance is 4. 200 / 4 = 50 units, a position worth 2,500.
If you move the stop closer, the number of units rises while the risk in currency stays the same. That is the point: you do not choose the position size, you choose the risk. The size follows from it.
Expectancy
The hit rate on its own says nothing. What matters is the expectancy per trade:
E = (win rate × average win in R) − (loss rate × average loss in R)
With a hit rate of 40 percent, an average win of +2R and an average loss of −1R: 0.4 × 2 − 0.6 × 1 = +0.2R per trade. So a system that is wrong six times out of ten is still profitable. The reverse also holds. A system with an 80 percent hit rate that wins +0.5R and loses −3R is clearly negative: 0.8 × 0.5 − 0.2 × 3 = −0.2R.
If you quote the hit rate alone, you leave out half of the calculation.
Drawdown arithmetic
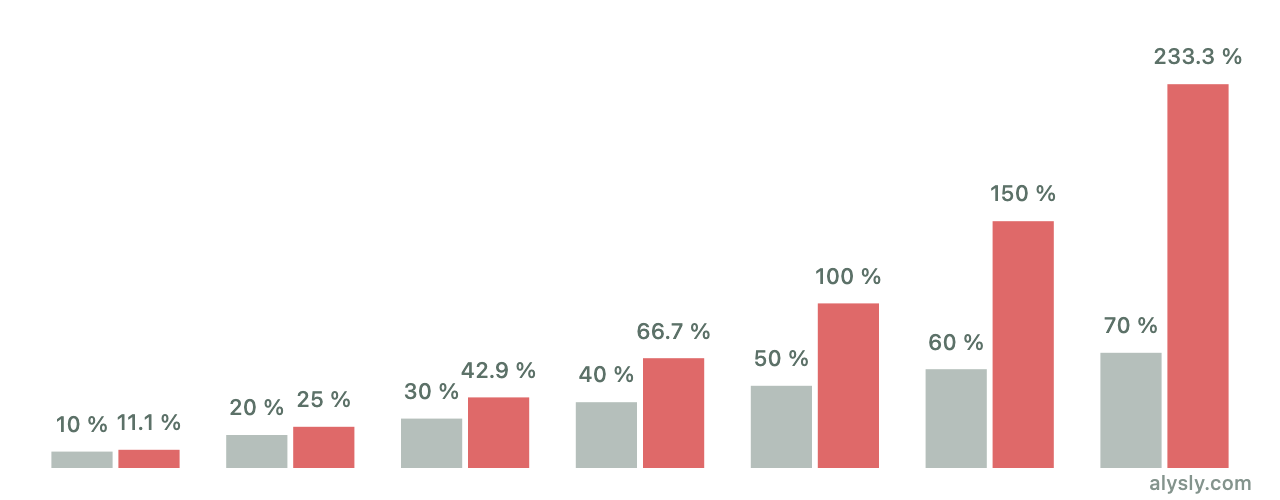
Loss and recovery are not symmetric. After a loss of 50 percent you need 100 percent to get back to even; after 70 percent you need 233 percent. This is why limiting losses matters more than the hit rate: one large loss costs more than a long series of small wins brings in.
The same arithmetic sets the ceiling for the risk per trade. With 2 percent risk and ten losses in a row – nothing exotic at a hit rate of 40 percent – the account is down by roughly 18 percent. With 5 percent risk per trade it would be 40 percent, and the recovery becomes a project of several years.
You can simulate how such streaks spread out over many runs. The Monte Carlo tool shows the range of possible paths instead of a single one.
Where the stop belongs
A stop marks the point at which the idea is wrong. It does not mark the amount you are willing to lose. Confusing the two is the most common mistake in this chapter.
In practice the stop sits beyond the zone whose break proves the idea wrong, plus a buffer for normal fluctuation. Placed directly below the last low, it gets hit by exactly the noise that every market contains. Later, in your own sample of trades , that shows up as a series of near misses that all ended just short of the target.
Next
The last article of this level puts technical analysis in context: what it can actually do, and what the evidence does not support.