Level 2 Patterns & indicators · Part 1/9
Candlestick Reversal Patterns
Reversal patterns made of one to three candles are the best-known part of Japanese charting. They all share one requirement: a trend has to come first. A “reversal pattern” inside a sideways range reverses nothing.
Single-candle patterns
Hammer
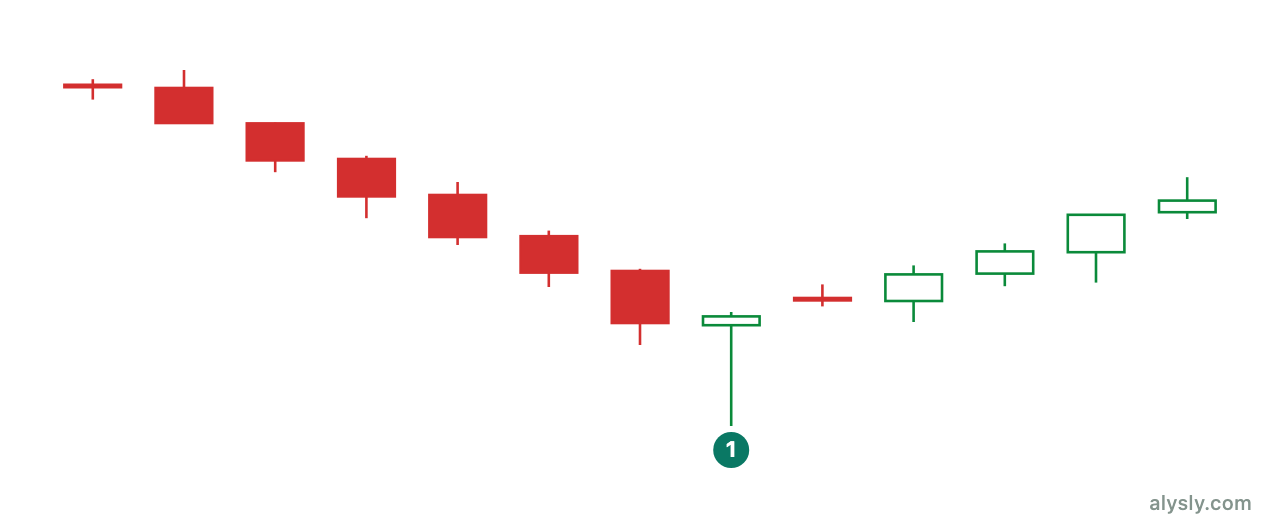
A small body at the top of the range, a long lower wick, almost no upper wick. As a rule of thumb, the lower wick is at least twice as long as the body. The color of the body is secondary.
The message is not in the name but in the sequence: the price fell a long way and was bought back completely. The same shape after a rally is called a hanging man and is read as a warning. Identical candle, different meaning – purely because of the context.
Shooting star
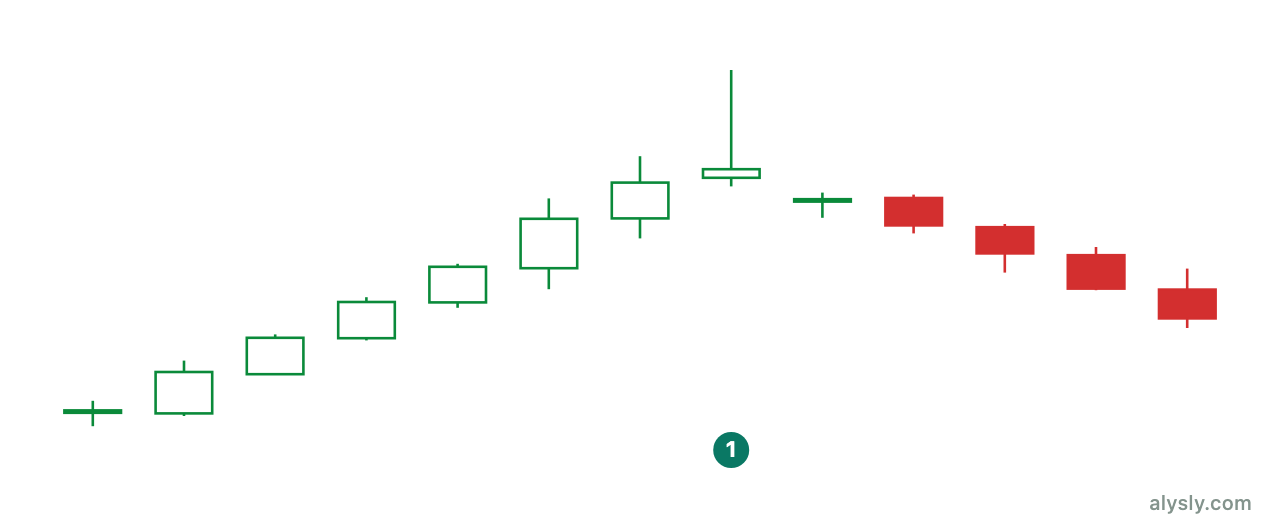
The mirror image after a rally: a small body at the bottom, a long upper wick. The market tested higher prices and rejected them. After a downtrend the same shape is called an inverted hammer.
Two-candle patterns
Engulfing
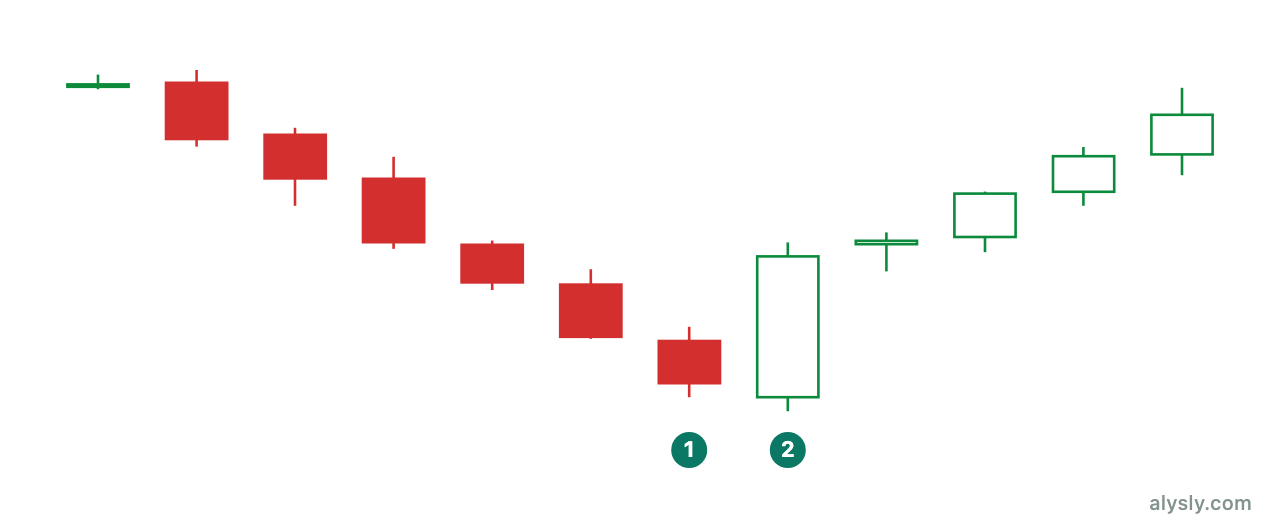
The body of the second candle covers the body of the first one completely and closes in the opposite direction. Only the bodies count, not the wicks.
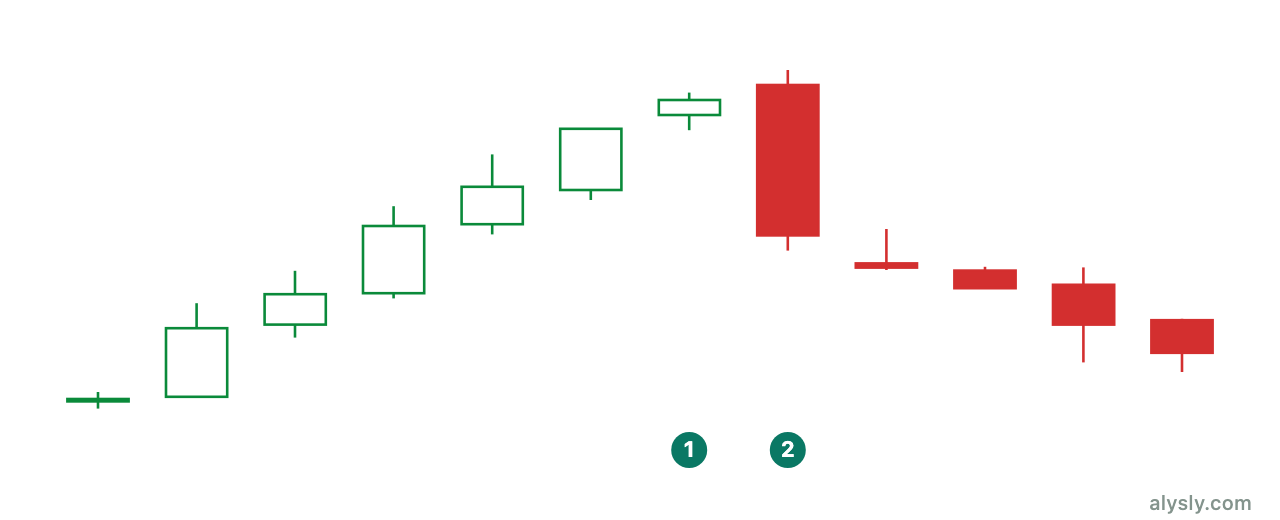
The larger the engulfing candle is compared with its neighbors, the clearer the statement. Two tiny candles meet the definition on paper but carry no information – a good test of whether you apply patterns mechanically or with understanding.
Harami
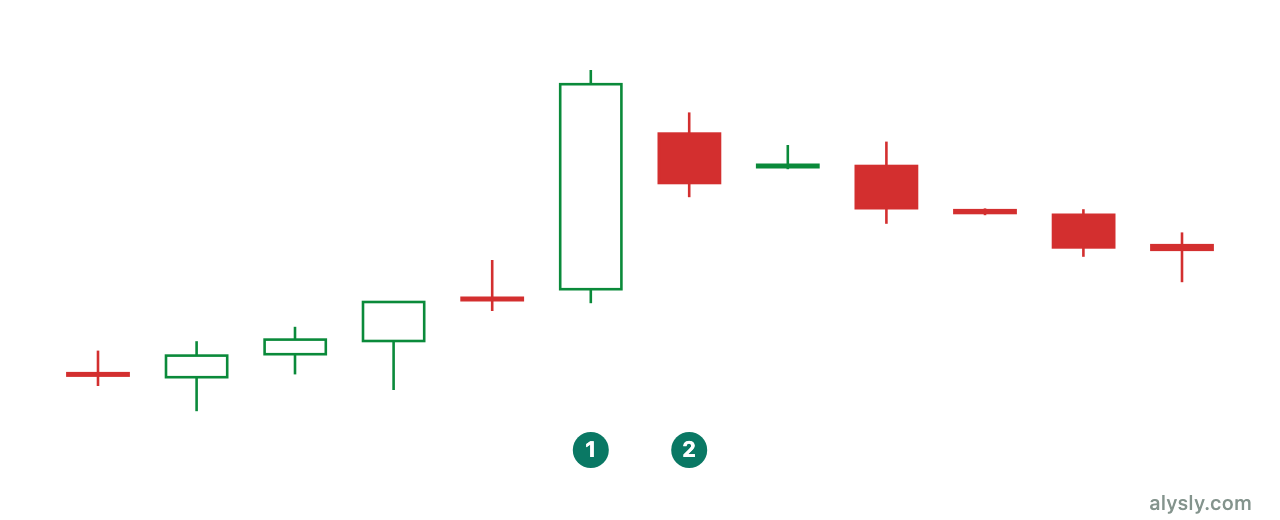
The opposite case: the second candle sits completely inside the body of the first one. A harami is not a reversal signal but a stalling signal – the move stopped gaining ground. What happens next is decided by the following candle, not by the pattern.
Piercing line and dark cloud cover
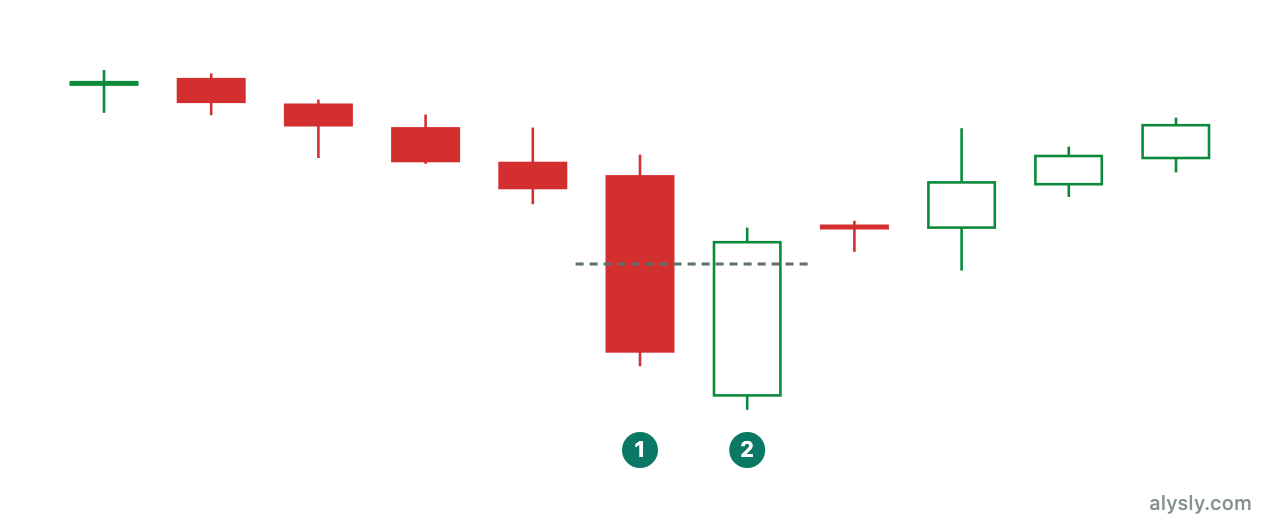
The second candle opens beyond the previous extreme and closes above (or below) the midpoint of the previous body.
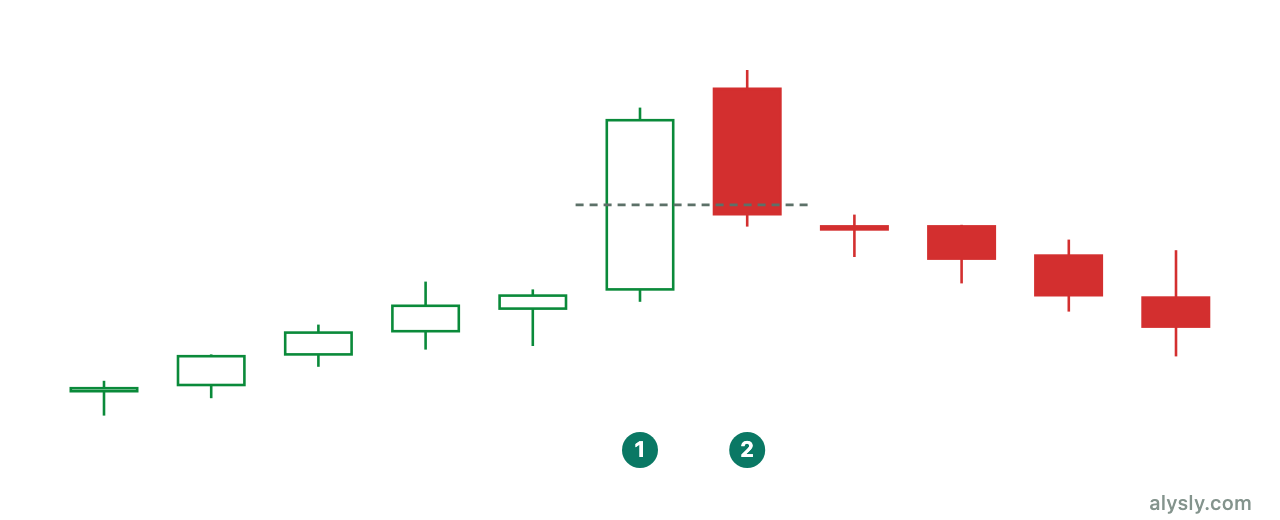
The midpoint is the real condition. A candle that pushes only slightly into the previous body is not a pattern but an ordinary pullback.
Tweezers
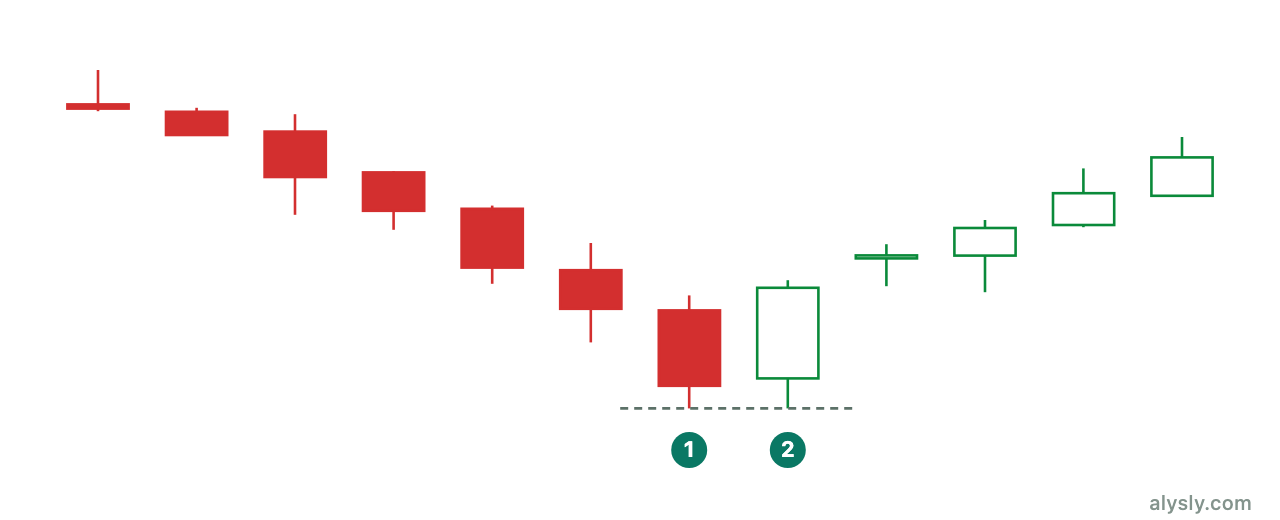
Two candles with almost identical lows (tweezer bottom) or highs (tweezer top). Their practical value lies less in the prediction than in the level: the shared extreme is a precise boundary, and once price passes it the idea is wrong. This is a pattern that supplies its own stop.
Three-candle patterns
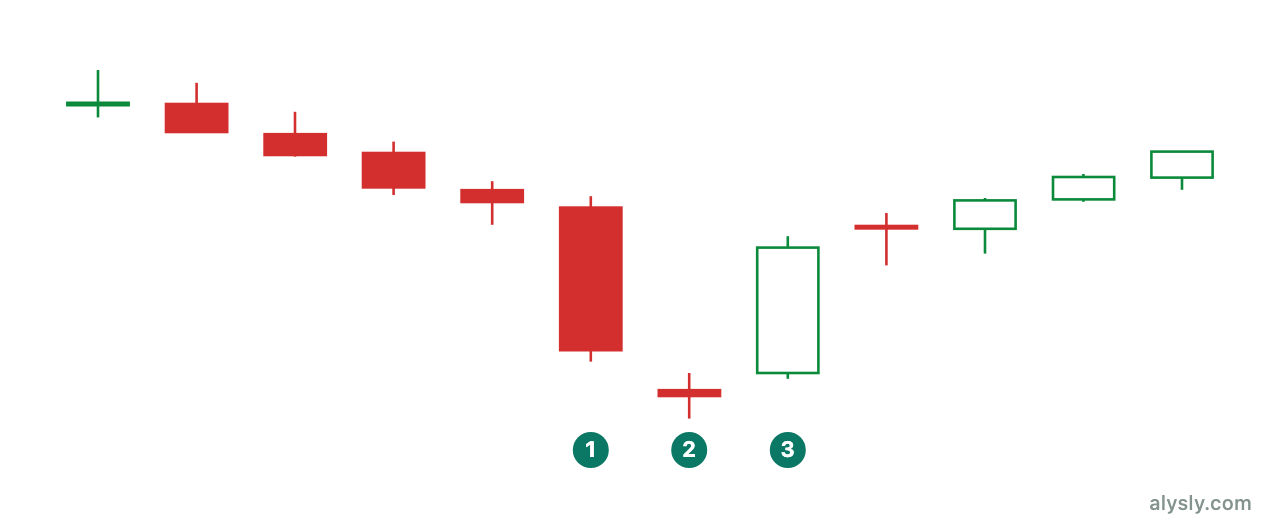
The morning star consists of a large down candle, a small candle at a lower level and a large up candle that closes deep inside the first body. The deeper it reaches, the more complete the change of mood.
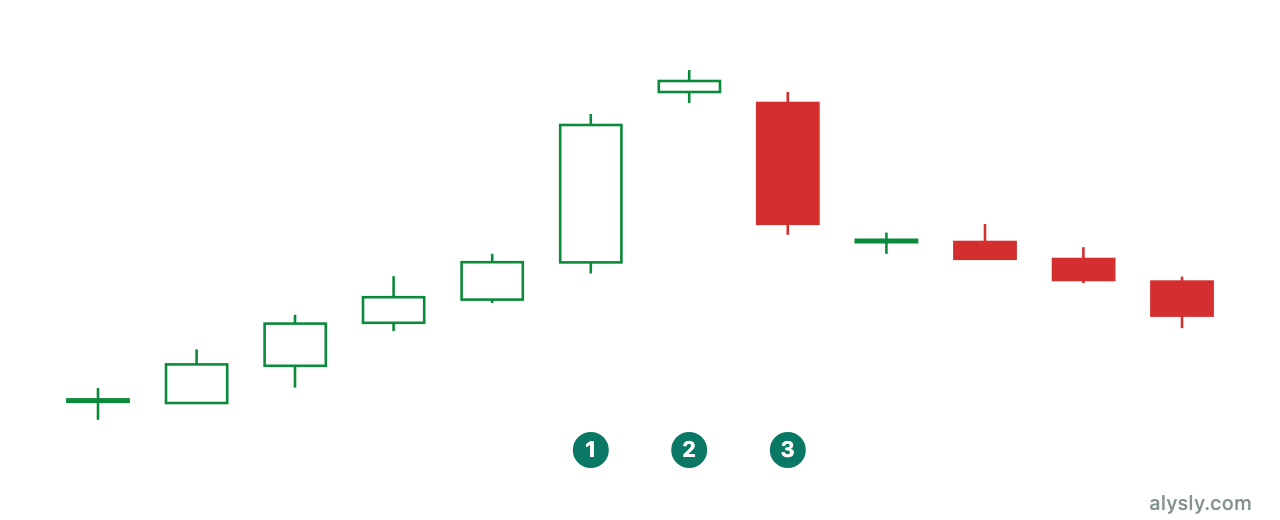
The evening star is its counterpart at the end of a rally.
The classic definition requires gaps between the candles. In markets that trade continuously – crypto, FX – those hardly exist. If you find the pattern there anyway, the definition has quietly been loosened. That is allowed, but it is then a different pattern from the one that was studied.
What applies to all of them
| Condition | Why |
|---|---|
| A trend has to come first | Without a trend there is nothing to reverse |
| Size relative to the surroundings | A pattern of below-average candles is noise |
| Position at a known zone | The same pattern counts for more at the edge of a range than in the middle of nowhere |
| Confirmation by the next candle | The pattern describes the past, not the next period |
And the most important limit: candlestick patterns are short-term. They describe the balance of one to three periods. Turning them into a forecast for the coming weeks stretches them far beyond their range.
Next
The next article covers patterns that signal continuation instead of reversal.