Level 2 Patterns & indicators · Part 3/9
Reversal Chart Patterns
Reversal formations run for weeks or months. Unlike candlestick patterns, they do not describe a balance of forces but a process: a trend slowly loses the ability to produce new extremes.
Head and shoulders
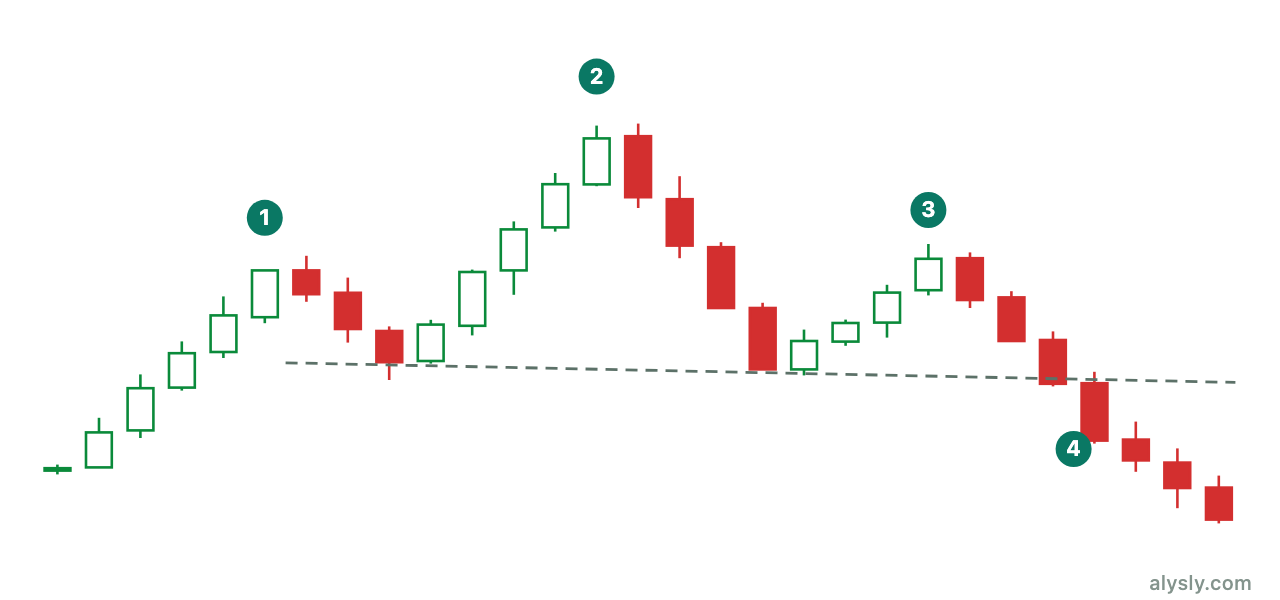
Three highs, with the middle one the highest. The line that connects the two lows in between is the neckline.
The decisive point is often overlooked: the formation is only complete once the neckline breaks. Before that you have price action with three peaks, and that appears constantly in every chart. Trading before the break means trading a guess about an unfinished shape.
The textbook target is the distance from the head to the neckline, projected down from the break. That rule is a convention from the charting tradition, not a measured value. It gives you an order of magnitude, not a forecast.
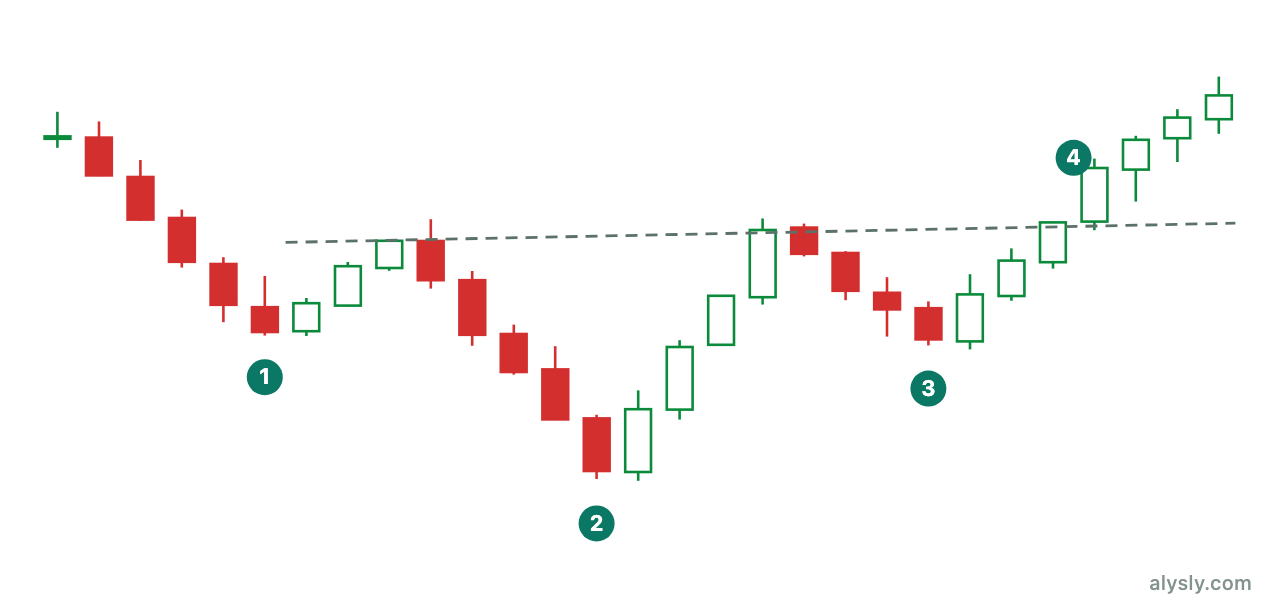
At a bottom, the same formation appears upside down. Bottom formations usually need more time than tops: panic is fast, confidence comes back slowly. That asymmetry is one of the more robust observations in charting.
Double top and double bottom
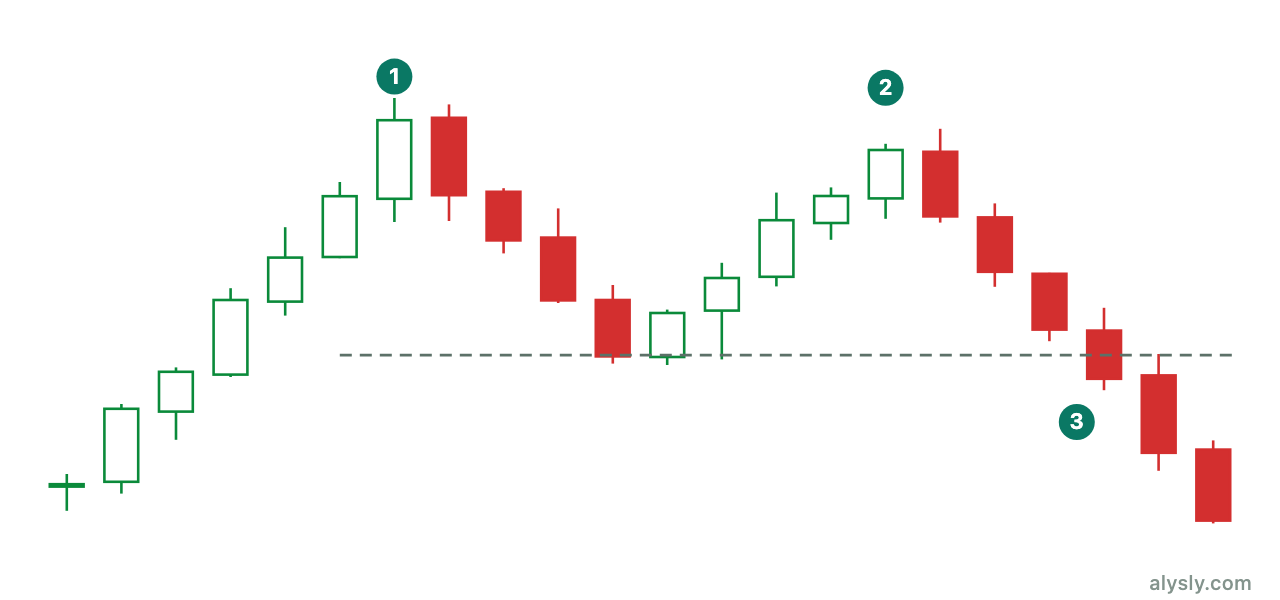
Two highs at roughly the same level. What confirms the formation is not the second high but the break of the low in between – only then is the sequence of higher lows broken.
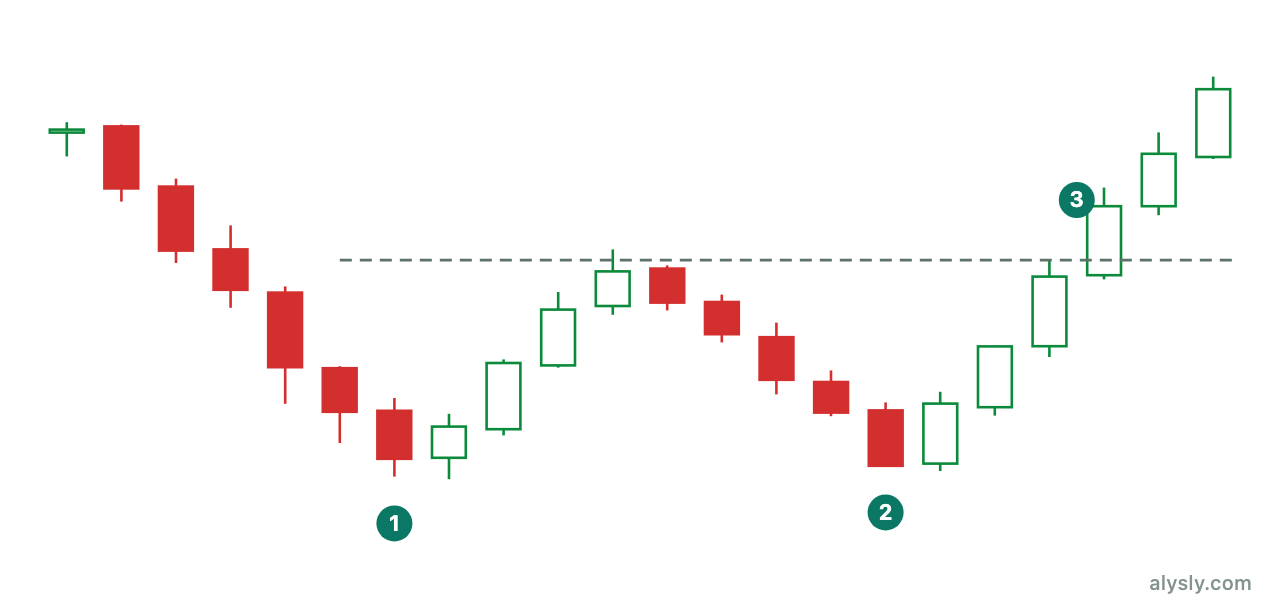
At a bottom it works the same way. More important than the exact equality of the two extremes is the time between them: two lows a week apart are a detail, while two lows two months apart mark a zone that held twice, independently.
Triple formations follow the same logic. They are statistically rarer – not because the market avoids them, but because a zone that has held twice often breaks on the third attempt.
Rounding bottom
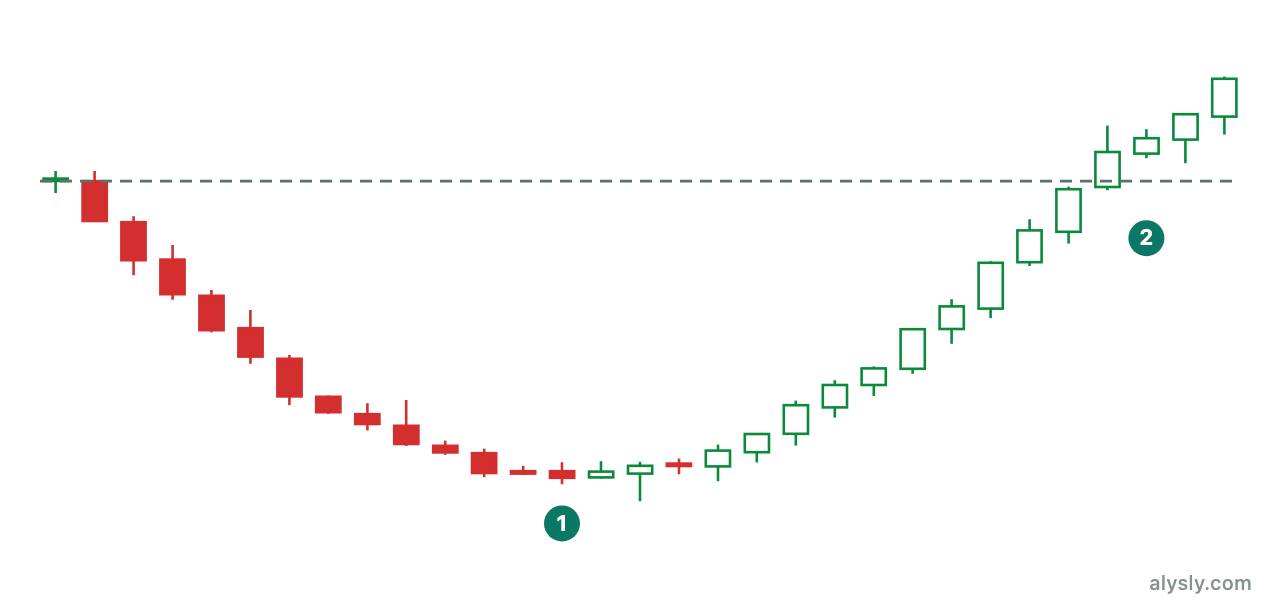
Not a turning point but a slow rotation: downward pressure fades, the price flattens out, and the recovery sets in step by step. The shape only becomes tradable with the break above the rim.
Rounding bottoms need time, typically months. On short timeframes you only find them by reading them into the chart, because the shape is smooth enough that almost any price series fits it somewhere.
What reversal formations give you
Three things you can use: a level (the neckline or the extreme in between), a point of refutation (a move back into the formation) and an order of magnitude (the height of the formation).
What they do not give you is a probability. The hit rates published in pattern books come almost entirely from visually selected examples without a clean base rate. How you actually establish such a number is covered at the end of this level in testing a pattern .
Next
The other side: formations that describe a pause in the trend rather than its end.