Level 2 Patterns & indicators · Part 5/9
Moving Averages
The moving average is the oldest and most widely used indicator. It answers exactly one question: where did the price sit on average over the last n periods?
SMA and EMA
The simple moving average (SMA) gives every one of the last n closes the same weight. The exponential moving average (EMA) gives recent prices more weight. It reacts faster and turns earlier, but it is wrong more often.
Which one is “better” depends only on what you want to buy: a faster reaction or fewer false signals. You cannot have both. Choosing between SMA and EMA is not an optimization, it is a trade-off.
The period
Common values are 20, 50, 100 and 200 periods. These numbers have no mathematical basis. They are convention – and they work partly because so many participants watch the same lines.
A 200-day average shows the long-term direction and is crossed rarely. A 20-day average stays close to the price and is crossed constantly. What matters is that you fix the period before the analysis. If you pick the period that would have worked best in hindsight, you are fitting a parameter to the past and learning nothing about the future.
Crossovers
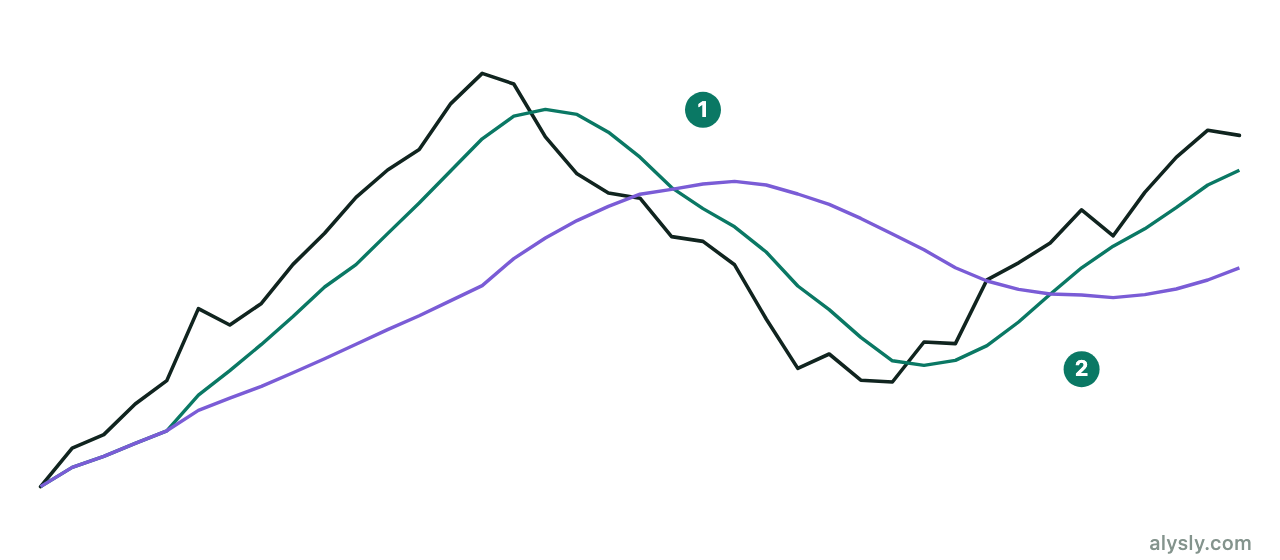
When a short average crosses a long one from below, it is called a bullish crossover. With periods of 50 and 200, the name golden cross has stuck, and death cross for the opposite case.
The names are more spectacular than the substance. A crossover is a mechanical consequence of price movement, not extra information: it happens after the price has already moved a long way. Studies of these signals regularly find that their advantage over simple buy-and-hold is small and not stable across periods.
The built-in lag
Every average is history. A 50-day average has its center of mass roughly 25 days in the past. It cannot turn earlier than the price, only later.
That leads to systematic behavior:
- In trends, averages work well, because the lag costs little.
- In sideways phases, they produce one false signal after another, because the price keeps crossing back and forth.
Since sideways phases take up most of the time, crossover systems usually have a low hit rate, and a few large trends carry the result. If you look at the hit rate alone, a working system looks broken. Expectancy tells the other half of the story.
Sensible uses
- Trend filter: only take positions in the direction of the higher average. That cuts the number of opportunities and raises their quality.
- Dynamic zone: in strong trends the price often runs along an average. The area around the line then takes the place of a horizontal support.
- Slope instead of position: do not only ask whether the price is above the line, but whether the line is rising. The slope is the more stable measure.
Next
The next article covers indicators that track speed rather than direction: oscillators.