Level 2 Patterns & indicators · Part 6/9
Oscillators: RSI and Stochastics
Oscillators measure speed, not direction. They move between fixed limits – which is where the name comes from – and they are misread with great regularity.
How the RSI is calculated
The relative strength index compares the average up moves of the last n periods with the average down moves and puts the result on a scale from 0 to 100. The standard setting is n = 14.
What follows from this matters. An RSI of 80 means that up moves clearly dominated down moves over the last 14 periods. It does not mean that the price is too high. It contains no information about value at all.
The “overbought” misconception
By convention, the levels 70 and 30 are labeled overbought and oversold. Those two words are the source of the most common mistake in the whole of indicator practice.
In a strong uptrend the RSI stays above 70 for weeks. Selling at 70 means selling at the start of the trend. The same is true the other way around: in a downtrend it stays below 30 for just as long. A high RSI is a sign of strength, not of excess.
The levels only mean something in a clearly sideways phase – which is exactly the situation where the question matters least. That is not a flaw of the indicator, but of the way it is usually described.
Divergences
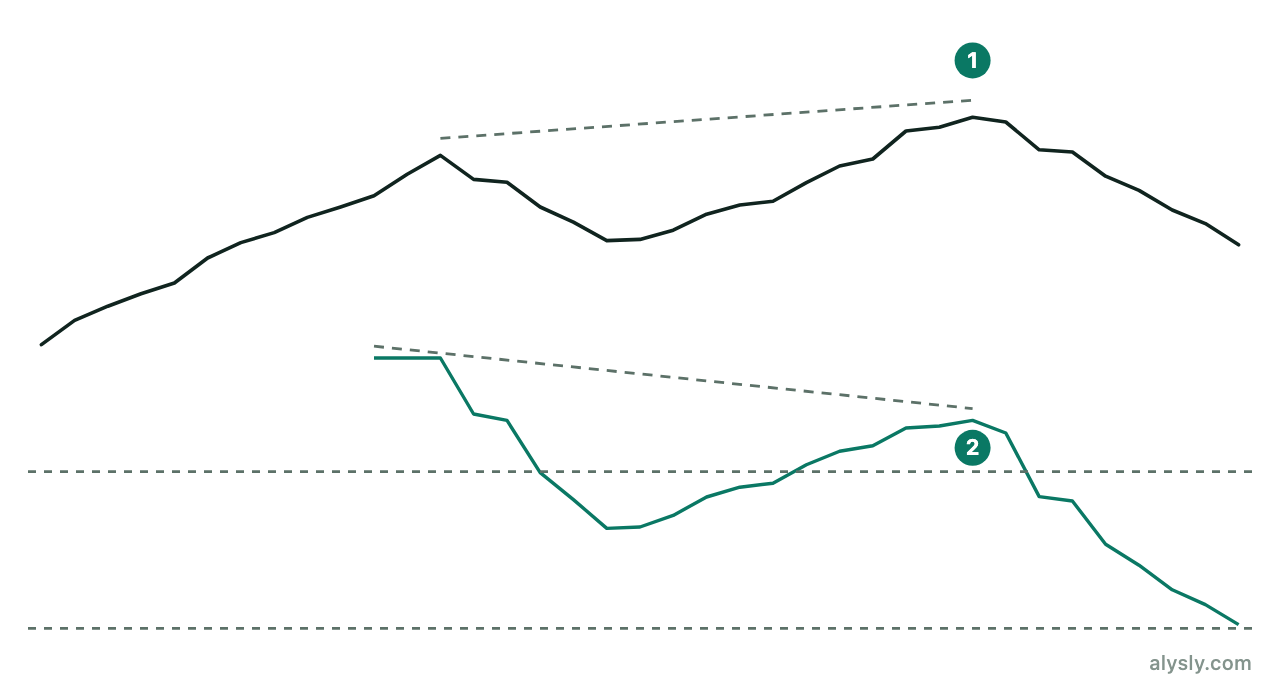
The more robust use: price and oscillator move apart. If the price makes a higher high while the RSI makes a lower one, the new move is carried by less momentum than the previous one.
Two limits are rarely mentioned:
- Divergences can last a long time. They are not a timing tool. In a strong trend, several appear in a row and nothing happens.
- Divergences depend on your selection. Which highs you compare is a judgment call. Look long enough and you will find one in any chart.
Useful as an observation, unusable as a signal – that sums up the state of the evidence.
Stochastics
The stochastic oscillator measures something different from the RSI: where the close sits inside the range of the last n periods. A close at the top of the range puts the value near 100.
It reacts faster than the RSI and is correspondingly noisier. The usual smoothing (%K and %D) is an attempt to win that back, and it is the same trade-off as between SMA and EMA.
What oscillators are actually good for
- As a description of the state: “up moves have dominated for two weeks” is a legitimate statement that you can check.
- As a filter: combined with a trend filter, to find entries in the direction of the trend after a pullback.
- Not as a reversal signal in a trend. That is the use they are famous for, and the one where they fail systematically.
Next
MACD and ADX measure changes in momentum and the strength of a trend instead. That is the next article.