Level 2 Patterns & indicators · Part 7/9
MACD and Trend Strength
MACD combines two ideas from the previous articles: it is built from moving averages, but it behaves like an oscillator.
Construction
It has three parts:
- The MACD line is the difference between two exponential averages, by convention 12 and 26 periods.
- The signal line is a 9-period EMA of the MACD line.
- The histogram is the difference between the two lines.
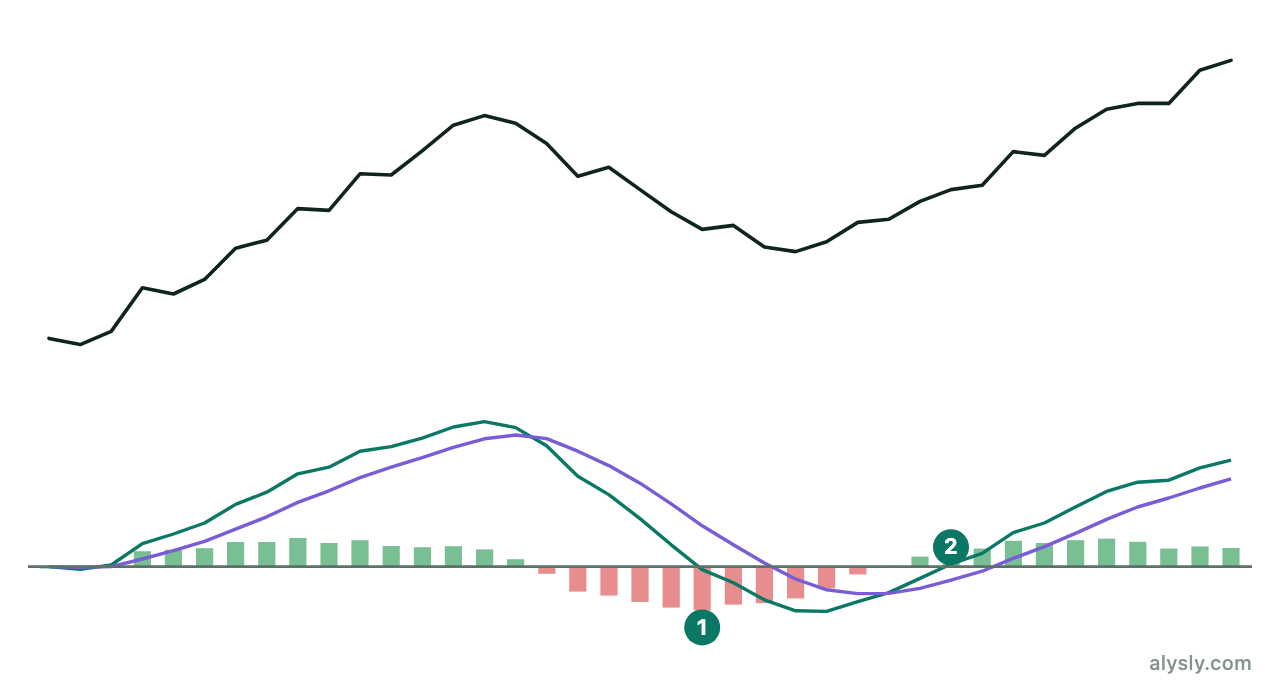
Because the line is a difference, it does not measure the price level. It measures the distance between the short and the long average, which is the change in momentum. A rising MACD means the trend is speeding up. A falling MACD while prices still rise means the move is slowing down.
The three usual readings
- Signal line crossover. The fastest but least reliable signal. In sideways phases it flips constantly.
- Zero crossing. The same thing as the two underlying averages crossing. Slower and steadier.
- Divergence with price. The same observation as with the RSI, and with the same limits.
The histogram turns before the lines do, so it is the fastest but also the noisiest part. Using it on its own means trading the second derivative of the price – and inside the noise that is barely different from zero.
The scaling problem
One practical point is missing from most descriptions: MACD is not normalized. Its value depends on the price level and the volatility of the instrument. A MACD of 2.5 means something completely different for a stock at 30 than for an index at 18,000.
Two things follow. MACD values cannot be compared across instruments, and fixed thresholds are meaningless. Only the path within the same instrument is comparable.
ADX: strength without direction
The average directional index measures how strong a trend is, without saying which way it runs. Values below roughly 20 count as trendless, values above 25 as trending. Those boundaries are convention, not measurement.
Its use is as a filter. Almost every indicator works either in trends or in ranges, never in both. A measure of strength answers the question that comes first: which of the two states are you in, and therefore which tool applies at all.
The limit is the same as everywhere else: ADX rises after a trend has started. It confirms, it does not announce.
The real lesson of this chapter
Every indicator in this level – averages, RSI, MACD, ADX – is a function of the same price series. They add no information; they only present existing information in a different form.
Two things follow from that. Five indicators in one chart do not increase your certainty. They create apparent confirmation out of measures that are highly correlated with each other. And no indicator can show something that is not already in the price series. The question is therefore never which indicator is right, but which property of the series you want to see.
How strongly different instruments and measures really move together can be measured. The correlation matrix does exactly that for markets.
Next
A measure with no direction at all that is still immediately useful: volatility.