Level 1 Reading charts · Part 4/7
Support and Resistance
Prices do not turn at random places. Some areas get tested again and again and hold – until they do not. The area below the price is called support, the area above it resistance.
Zones, not lines
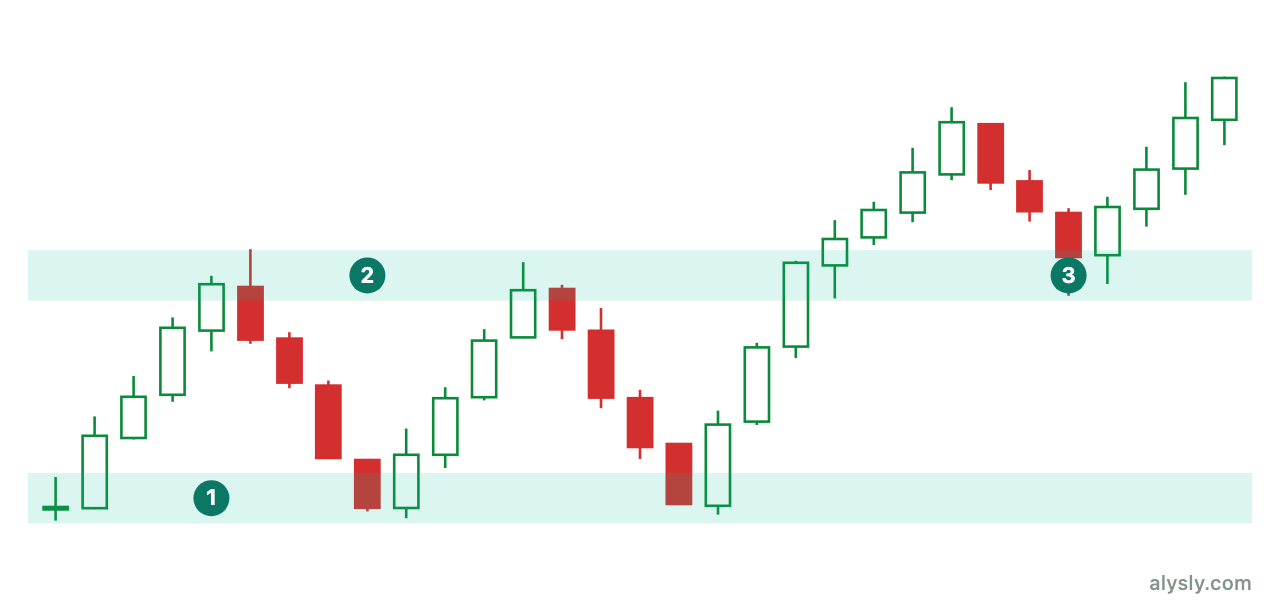
A price never turns at exactly the same value twice. It turns inside a band. If you draw support as an exact line, you create two errors at once. You see “false breakouts” where the band was simply used up, and you place your stops exactly where noise is most likely to reach them.
In practice, the zone runs from the lowest wick to the highest body close of the candles involved. The more often it has been tested, and the more time passed between the tests, the more relevant it is.
Role reversal
The most useful observation in this chapter is role reversal: broken resistance often becomes support, and broken support often becomes resistance. In the chart above, that is exactly what happens after the breakout.
The reason is mechanical, not mysterious. At the old resistance, participants sold because they expected a high there. Once the price trades above it, their view changes. Those who sold want back in, and those who bought defend their entry. Both groups create demand in that same area.
Where these areas come from
Three sources explain most of the effect:
- Memory of price levels. Participants look back at earlier highs and lows, because that is where they got in or out. Their behavior is what makes the level work.
- Order clusters. Stop orders and limit orders build up at prices that stand out. When they trigger, a fast move follows – which is why breaks so often come with a sudden push.
- Round numbers. 100, 1,000, 20,000: people and trading systems prefer to place orders there. The effect is small but measurable, and it shows up in almost every market.
Self-reference and its limit
Support and resistance are partly self-fulfilling: they work because many participants watch them. That is not an objection – it is the explanation. But the effect has a natural ceiling. Once enough capital sits on a level, that level becomes a target for the other side. This is why the most famous levels are also the least reliable.
When a zone breaks
A break is not automatically a signal. Three cases need to be separated:
| What happens | How to tell | |
|---|---|---|
| Breakout | price leaves the zone and stays out | the next candles hold the level, often on higher volume |
| False breakout | price leaves the zone and comes back | fast snap back, usually with a long wick |
| Test | price touches the zone from outside and turns | role reversal, see above |
Telling them apart is easy afterwards and hard in the moment. That is exactly why every decision at a zone needs a level, fixed in advance, at which the idea counts as wrong – the subject of this level’s risk article.
Next
Volume shows whether a breakout is carried by real participation. That is the next article.