Has Bitcoin Become a Normal Asset?
Bitcoin is often described as a maturing asset: less wild, more institutional and closer to a normal portfolio holding. But what does “normal” actually mean? Lower volatility, a manageable relationship with other assets and drawdowns that do not dominate the risk of a portfolio. All three can be measured, and our daily data show that Bitcoin has become somewhat calmer while still being very different from a typical stock-market holding.
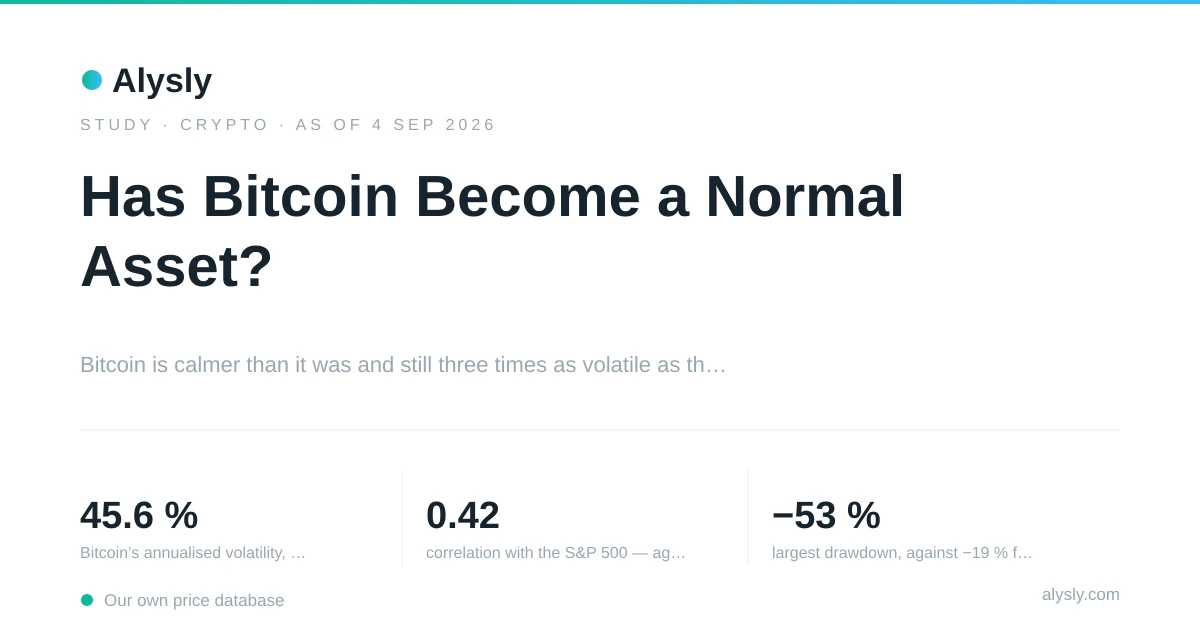
- 45.6%Bitcoin’s annualized volatility, Jul 2024 – Sep 2026
- 0.42correlation with the S&P 500, versus 0.14 with gold
- −53%largest drawdown, versus −19% for the S&P 500
- 7.8%of the 103 coins that existed throughout the period outperformed Bitcoin
What Would “Normal” Have to Mean?
Calling an asset “normal” is not really about how it feels. It is a set of things we can measure.
A normal portfolio holding should not move three times as much as the stock market . It should not lose half its value while stocks lose a fifth. And if it is meant to diversify a portfolio, it should not simply move in the same direction as the assets already in it.
Our study window starts on July 11, 2024, so it covers a little more than two years. Bitcoin gained 38.9% over that period, equal to 16.5% a year.
But the return itself is not the most interesting number. The more useful question is how Bitcoin produced that return.
Bitcoin Is Calmer — but Still Far More Volatile
Volatility tends to come in waves. Quiet periods are usually followed by quiet periods, while turbulent markets tend to stay turbulent for a while. If Bitcoin is becoming a calmer asset, that should show up in its rolling volatility.
Loading figure …
It does. The median rolling volatility falls from 52.9% in the first half of the period to 43.2% in the second half. Across the full period, Bitcoin’s annualized volatility was 45.6%.
The comparison with stocks puts those numbers into perspective. The S&P 500 is currently at around 14%. Bitcoin has become roughly one-fifth less volatile than it was two years ago, but it still moves about three times as much as the stock market.
That matters for a portfolio. A position that moves three times as much as an index fund can affect total portfolio risk far more than its weight alone suggests.
The drawdowns tell a similar story. Bitcoin’s largest peak-to-trough decline during the period was −53.0%, reached at the end of June 2026. The S&P 500’s largest decline was −19.0%.
The difference becomes even clearer when looking at the recovery required. After a 53% loss, Bitcoin needs to gain about 113% just to return to its previous high. After a 19% loss, the S&P 500 needs about 23%.
Bitcoin Moves More With Stocks Than With Gold
Volatility is only part of the question. The other issue is what role Bitcoin plays when other markets move.
There are two common ways to think about Bitcoin. One is as digital gold, an asset that moves independently of traditional markets. The other is as a high-risk asset that rises and falls with investors’ appetite for risk, much like technology stocks.
Loading figure …
Over the full period, Bitcoin’s correlation with the S&P 500 is 0.42 and its correlation with the Nasdaq 100 is 0.41. Its correlation with gold is only 0.14. So over this period, Bitcoin moved about three times more closely with stocks than with gold.
But the average hides a lot of movement. The rolling correlation with stocks ranged from 0.24 to 0.59, the one with gold from −0.04 to 0.51. In the most recent 90-day window the order had even reversed: 0.51 with gold versus 0.28 with the S&P 500.
That does not tell us whether Bitcoin has entered a new long-term regime, because one 90-day window is not enough to answer that question. What it does show is that Bitcoin does not have one stable relationship with other assets.
A more direct test is what happens on the worst stock-market days. On the 20 worst days for the S&P 500 during the period, the index lost an average of 2.64%. Bitcoin lost 3.05% on those same days and finished lower on 80% of them. Gold gained 0.06% on average.
Loading figure …
This is not how a hedge behaves. On the days when a portfolio was under the most pressure, Bitcoin generally moved in the same direction and made the loss slightly larger. Gold behaved differently on those days.
So Bitcoin may be becoming more established, but the data do not show it becoming a diversifier in the usual sense. During this period, it behaved more like a high-risk position tied to overall risk appetite.
Bitcoin Is the Established Asset Within Crypto
The third change is easier to see when we look at Bitcoin’s position inside the crypto market.
Of the 103 coins that were already trading when our window began, only 8, or 7.8%, outperformed Bitcoin over the same period. Looking at all 309 coins with at least 400 days of history gives 2.9%. That comparison is less useful, however, because coins launched later had less time to compete with Bitcoin over the full period.
The altcoin season index tells a similar story. It measures how many of the 50 largest coins outperform Bitcoin over 90 days. On September 4, 2026, it stood at 37 out of 100. Over 696 days up to that date, there were 5 altcoin seasons lasting a total of 26 days, compared with 36 Bitcoin seasons lasting 250 days.
Bitcoin therefore led its own market on almost ten times as many days as the broad altcoin market did.
That does not mean Bitcoin became safe. It means that, within crypto, Bitcoin has increasingly taken the more established end of the market.
What This Data Cannot Tell Us
The main limitation is the time period.
Two years and two months include one major drawdown and one recovery. They do not include a full halving cycle or a multi-year bear market. Our Bitcoin prices go back to 2017, but our daily stock data does not, so this study cannot compare today’s market with 2017 or 2021 on the same terms.
That matters. A claim that Bitcoin’s volatility is falling over the long term would need a much longer history. What we can say is more limited: volatility declined within this particular period.
There are two other limitations. First, the comparison with other coins includes only coins that still trade, so the 7.8% figure does not capture coins that disappeared. Second, a correlation of 0.42 is only an average. The rolling correlation moved a lot during the period, so a portfolio built around the average alone would assume a relationship that often looked different.
The Short Answer
Bitcoin has become somewhat more normal, but the change is limited.
It is less volatile than it was two years ago, it has become more established within the crypto market, and its role in a portfolio is easier to describe.
But it is still about three times as volatile as the stock market, and its largest drawdown was almost three times as deep as the S&P 500’s. On the worst stock-market days, Bitcoin usually fell as well.
The arithmetic shows what that means at the portfolio level. At 45.6% annualized volatility, a 5% weight in Bitcoin carries about as much volatility as a 16% weight in the S&P 500, looking at volatility alone and ignoring how the two move together.
The useful question is therefore not whether Bitcoin has matured. It is how much risk a given weight adds to a portfolio.
Data and Method
- Data basis
- cx:btc · Jul 11, 2024 to Sep 4, 2026 · 786 trading sessions
- The study uses July 11, 2024 to September 4, 2026, the window in which we hold daily prices for Bitcoin, the S&P 500, the Nasdaq 100 and gold together. Our Bitcoin history goes back further, but without stock-market data for those years the correlation and stress tests cannot be run there. The window contains a little more than two years and one major drawdown: enough for volatility and correlation, too short for conclusions about long-term market cycles.
- Bitcoin trades every day, while US stocks trade on about 252 days a year. Volatility is therefore annualized using 365 days for crypto and 252 days for stocks, which keeps the two comparable.
- Correlations are Pearson correlations of daily returns on days when both markets traded, calculated over a rolling 90-day window. Correlations of price levels are not used, because two assets can both rise over time without their daily returns being closely related.
- The breadth comparison uses the 103 coins that were already trading when the window begins, so every coin is measured over the same period. Across all 309 coins with at least 400 days of history, 2.9% outperformed Bitcoin. That broader comparison is less useful, because coins listed later had less time to compete. Coins that were delisted are in neither figure.
- The altcoin season figures are cut at September 4, 2026, the cutoff date of the study. The tool page shows the current level.
Every figure comes from our own price database and is produced by a script in the repository. Running it again with the same cutoff date returns the same numbers. Not investment advice.