MSCI China Index
The MSCI China index combines H-shares, A-shares, red chips and US-listed ADRs of Chinese companies. It is the reference index for dedicated China exposure alongside a broad EM allocation.
The ten largest holdings make up 42.3% of the MSCI China, out of 573 holdings in total; the largest sector is Consumer Discretionary at 22.8% (as of Oct 31, 2026).
Composition – 50 Largest Holdings
Based on: Xtrackers MSCI China UCITS ETF 1d · as of Oct 31, 2026 · 573 holdings
| # | Stock | Ticker | Sector | Country | Weight |
|---|---|---|---|---|---|
| 1 | Tencent Holdings Ltd | 700 | Communication Services | China | 13.14% |
| 2 | Alibaba Group Holding Limited | 9988 | Consumer Discretionary | China | 9.14% |
| 3 | China Construction Bank Corporation Class H | 939 | Financials | China | 4.83% |
| 4 |  Industrial and Commercial Bank of China Limited Class H | 1398 | Financials | China | 3.08% |
| 5 | Xiaomi | Information Technology | China | 2.49% | |
| 6 | Bank of China Limited Class H | 3988 | Financials | China | 2.33% |
| 7 |  Meituan Class B | 3690 | Consumer Discretionary | China | 1.98% |
| 8 |  PDD Holdings Inc. Sponsored ADR Class A | PDD | Consumer Discretionary | China | 1.82% |
| 9 | Ping An Insurance (Group) Company of China Ltd. Class H | 2318 | Financials | China | 1.73% |
| 10 | Netease Inc | 9999 | Communication Services | China | 1.72% |
Show holdings 11 to 50
- BYD Company Limited Class H 1.43%
- JD.com Inc. Class A 1.28%
- PetroChina Co. Ltd. Class H 1.23%
 China Merchants Bank Co. Ltd. Class H 1.13%
- Agricultural Bank of China Limited Class H 1.04%
- China Life Insurance Co. Ltd. Class H 1.02%
- BeOne Medicines Ltd. 1.00%
- Trip.com Group Ltd. 0.99%
- Zijin Mining Group Co. Ltd. Class H 0.95%
- Lenovo Group Limited 0.93%
- Wuxi Biologics (Cayman) Inc. 0.90%
- Baidu Inc. Class A 0.89%
- China Shenhua Energy Co. Ltd. Class H 0.80%
- Innovent Biologics Inc. 0.67%
- Yum China Holdings Inc. 0.65%
 Kweichow Moutai Co. Ltd. Class A 0.64%
- PICC Property & Casualty Co. Ltd. Class H 0.62%
- China Petroleum & Chemical Corporation Class H 0.59%
- KE Holdings Inc. Class A 0.51%
- ANTA Sports Products Ltd. 0.51%
- Geely Automobile Holdings Limited 0.50%
- China Resources Land Limited 0.47%
- WuXi AppTec Co. Ltd. Class H 0.43%
 Kuaishou Technology Class B 0.42%
 Nongfu Spring Co. Ltd. Class H 0.40%
- China Pacific Insurance (Group) Co. Ltd. Class H 0.40%
- H World Group Limited Sponsored ADR 0.39%
 Contemporary Amperex Technology Co. Limited Class A 0.38%
- China CITIC Bank Corporation Ltd Class H 0.38%
- CSPC Pharmaceutical Group Limited 0.37%
 Pop Mart International Group Limited 0.36%
- China Hongqiao Group Ltd. 0.36%
- Bank of Communications Co. Ltd. Class H 0.36%
- Contemporary Amperex Technology Co. Limited Class H 0.34%
- ZTO Express (Cayman) Inc. Class A 0.33%
- China Merchants Bank Co. Ltd. Class A 0.33%
- CITIC Limited 0.31%
- Akeso Inc. 0.31%
- China Mengniu Dairy Company Limited 0.30%
- Li Auto Inc. Class A 0.29%
Sectors
Countries
MSCI China Price Chart
The chart shows daily closing prices and is set to the current year by default. The price is down 18.3% year to date and down 23.8% over twelve months. The last recorded close on October 30, 2026, was at 1% of the 52-week range.
Price series from our database since Aug 2, 2024, 564 daily values.
MSCI China Performance
| Year to date | -18.3% | 1 month | -6.0% |
|---|---|---|---|
| 3 months | -12.1% | 1 year | -23.8% |
| Calendar year 2025 | +28.2% |
MSCI China Index Funds and ETFs
ETFs Tracking This Index
Next Events
Technical Analysis: MSCI China
Risk Metrics
Correlations (90 Trading Days)
| Instrument | r | −1 … +1 |
|---|---|---|
| Full Truck Alliance Co. Ltd. Sponsored ADR | +0.65 | |
| PDD Holdings Inc. Sponsored ADR Class A | +0.65 | |
| Futu Holdings Ltd. Sponsored ADR Class A | +0.59 | |
| Consolidated Edison Inc. | -0.43 | |
| Fortis Inc. | -0.42 | |
| WEC Energy Group Inc | -0.41 |
The strongest co-movers are listed at the top, the strongest inverse movers at the bottom. Low or negative correlations can help spread risk more broadly across a portfolio.
Related Content: MSCI China
News About MSCI China
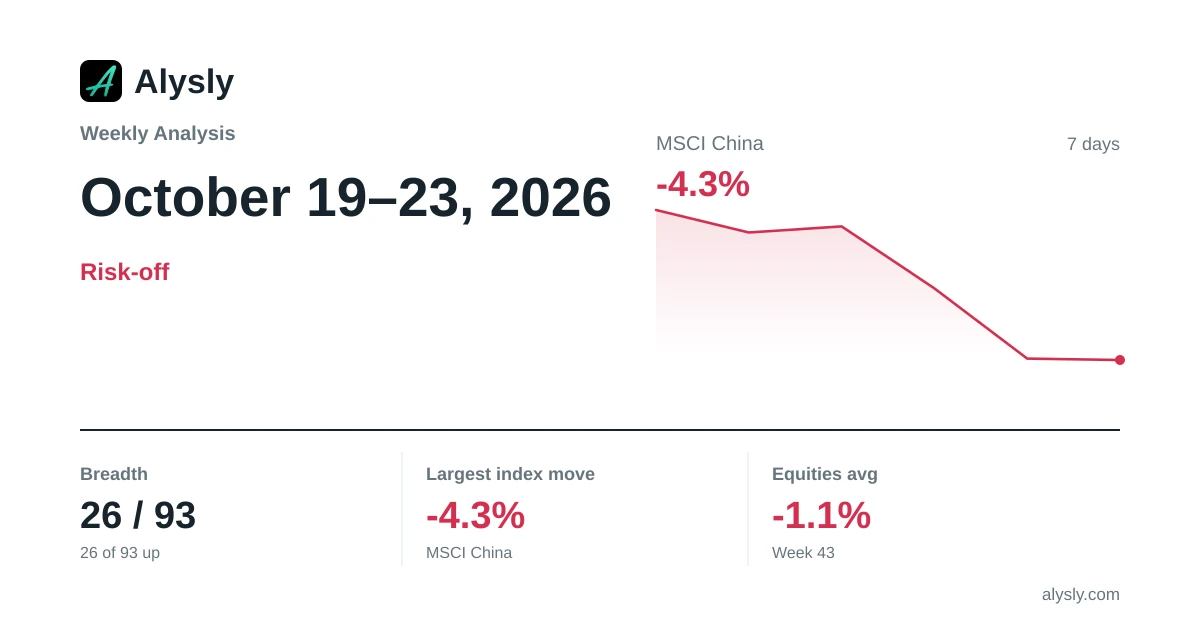 · Risk-off
Weekly Analysis: A Quiet Week, MSCI China -4.3% · October 19–23, 2026
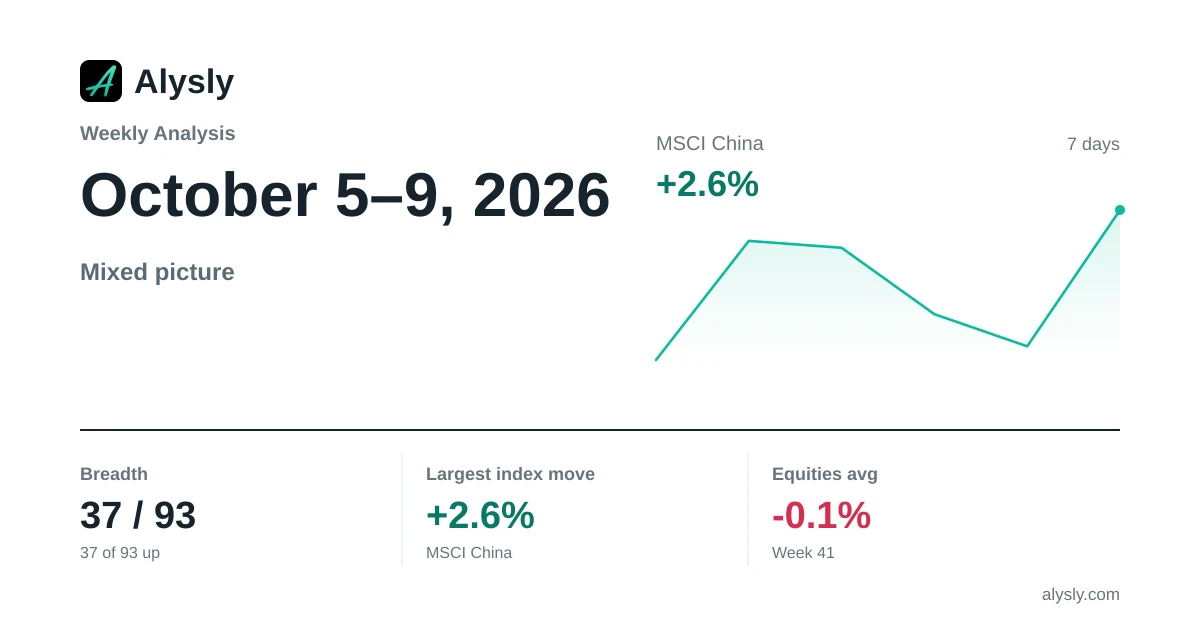 · Mixed
Weekly Analysis: MSCI China Leads the Week (+2.6%) · October 5–9, 2026
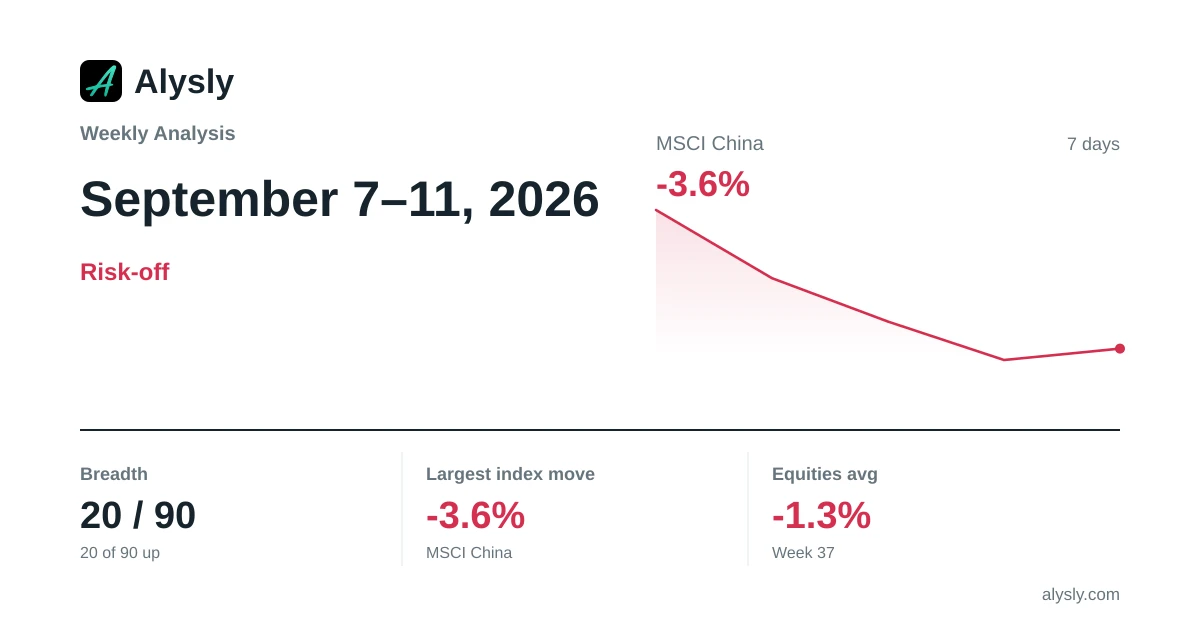 · Risk-off
Weekly Analysis: MSCI China Lags the Week (-3.6%) · September 7–11, 2026
 · Mixed
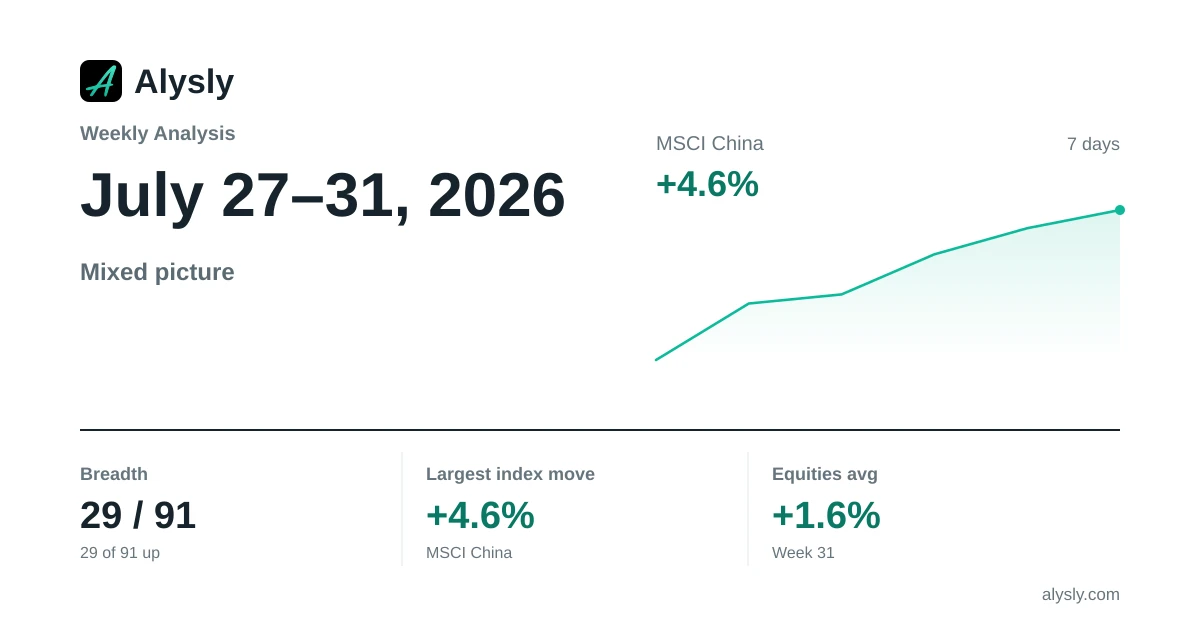
Weekly Analysis: MSCI China Leads the Week (+4.6%) · July 27–31, 2026