Weekly Analysis: DAX Sets the Tone for the Week (+2.2%) · October 26–30, 2026
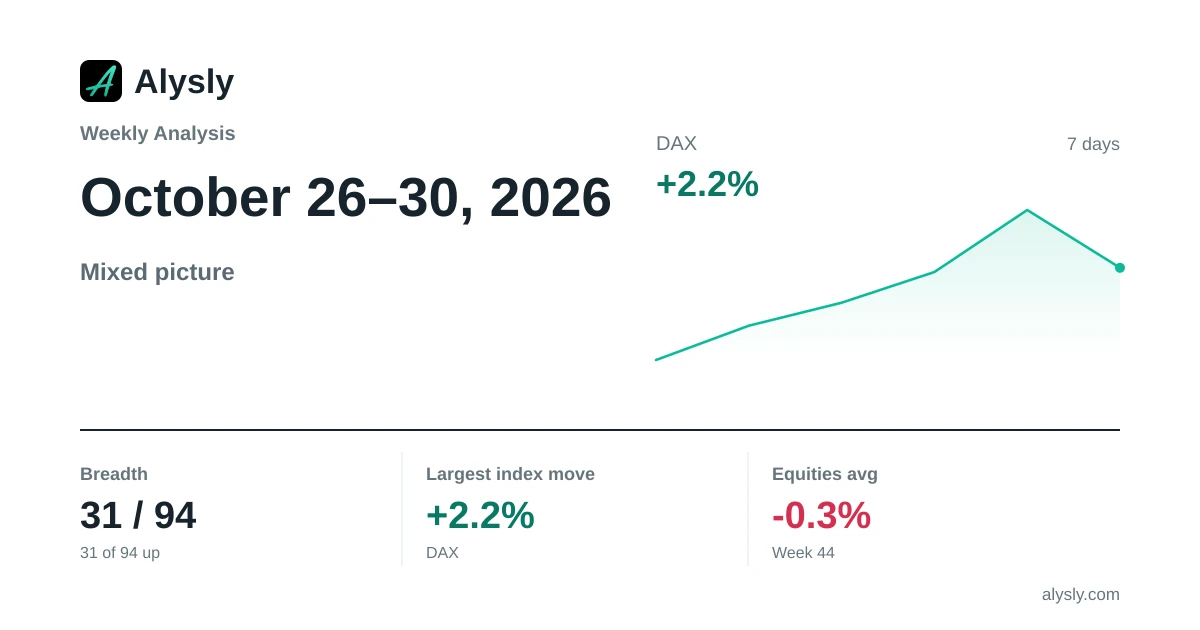
The trading week of October 26–30, 2026, in review: 31 of 94 tracked assets (33%) finished the week higher, with the major equity indices moving -0.3% on average over the week. The S&P 500 lost 0.6%, its third losing week in a row.
What Stands Out
Measured against our own price history, one reading stands out:
- 44 of the tracked US stocks closed Friday at a 52-week high, more than in any of the previous 12 weeks (which peaked at 43).
Weekly Barometer
On average, crypto assets led at +2.1%, while precious metals came last at -2.8%. 8 of 18 equity indices rose, as did 19 of 61 crypto assets.
Where the Major Markets Stand
The DAX had the largest weekly gain at +2.2%, the S&P 500 Information Technology the largest loss at -2.0%. The S&P 500 came in at -0.6%, the Euro STOXX 50 at +0.7% and the MSCI Emerging Markets at -1.6%.
In 89 of the 119 weeks before, the S&P 500 moved at least as much as it did this week (-0.6%), in either direction. That describes our series since Jul 12, 2024, and is not a probability for coming weeks.
| Index | Bar | Week |
|---|---|---|
| DAX | +2.2% | |
| MSCI Europe | +1.5% | |
| Russell 2000 | +1.3% | |
| Nikkei 225 | +1.0% | |
| MSCI EMU | +0.8% | |
| MSCI Emerging Markets | -1.6% | |
| Nasdaq 100 | -2.0% | |
| MSCI EM IMI | -2.0% | |
| Nasdaq Composite | -2.0% | |
| S&P 500 Information Technology | -2.0% |
| Market | Week | 2026 | From 52-Week High |
|---|---|---|---|
| MSCI World | -0.3% | +10.2% | -3.2% (high of Aug 13, 2026) |
| S&P 500 | -0.6% | +10.8% | -3.0% (high of Oct 6, 2026) |
| DAX | +2.2% | -2.4% | -6.7% (high of Aug 28, 2026) |
| Gold | +0.6% | -7.1% | -24.7% (high of Jan 29, 2026) |
| Bitcoin | -3.5% | -11.7% | -30.0% (high of Nov 2, 2025) |
All of the week's figures are in the overviews for indices, stocks, crypto, commodities, precious metals and FX.
What Large Market Participants Reported
At 3 companies, at least three different executives, directors or major shareholders reported an open-market purchase in the 30 days to Friday. The trades reported over the past 30 days are listed in the markets overview. Such a cluster says nothing about where the price goes next.
Real Assets Next to the Markets
9 auction sales were recorded this week. The top lot was the Lamborghini Diablo at $1,063,000. The individual sales and their price range are on the real asset pages.
Over twelve months, the range runs from +243.1% (Trading card price index) to -28.6% (Bitcoin); the reference dates are shown at each bar.
| Series | Bar | 12 months |
|---|---|---|
| Trading card price indexas of Sep 28, 2026 | +243.1% | |
| S&P 500as of Oct 30, 2026 | +11.2% | |
| MSCI Worldas of Oct 30, 2026 | +10.8% | |
| Euro area home pricesas of Jun 30, 2026 | +3.8% | |
| US home pricesas of Aug 1, 2026 | +2.4% | |
| Goldas of Oct 29, 2026 | +0.8% | |
| German home pricesas of Jun 30, 2026 | +0.6% | |
| Bitcoinas of Oct 30, 2026 | -28.6% |
Official Dates in the Following Week
- : ADP employment report (US)
- : US initial jobless claims
- : US jobs report
Officially confirmed dates only; the economic calendar lists more.
Latest Investment Analysis
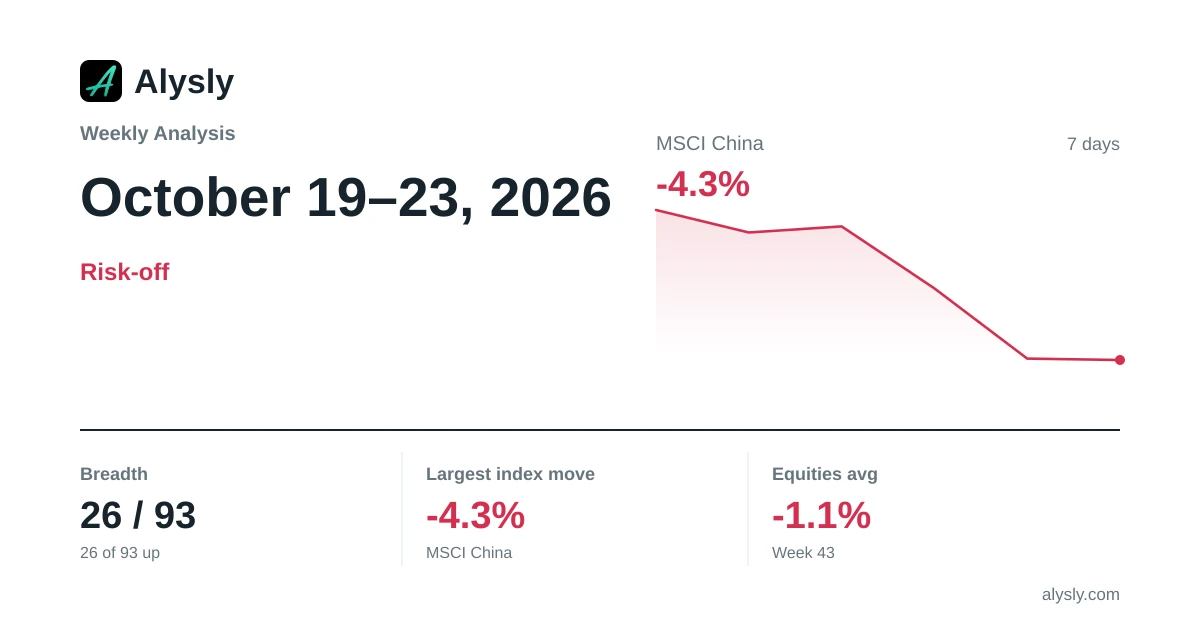 · Risk-off
Weekly Analysis: A Quiet Week, MSCI China -4.3% · October 19–23, 2026
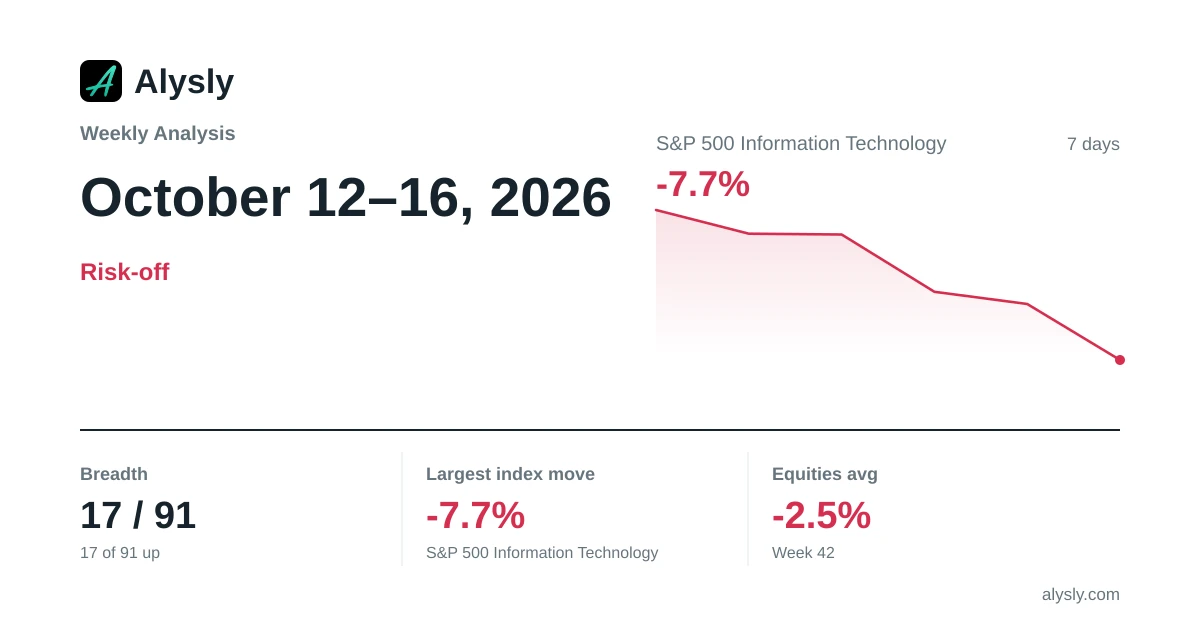 · Risk-off
Weekly Analysis: S&P 500 Information Technology Weighs on the Week (-7.7%) · October 12–16, 2026
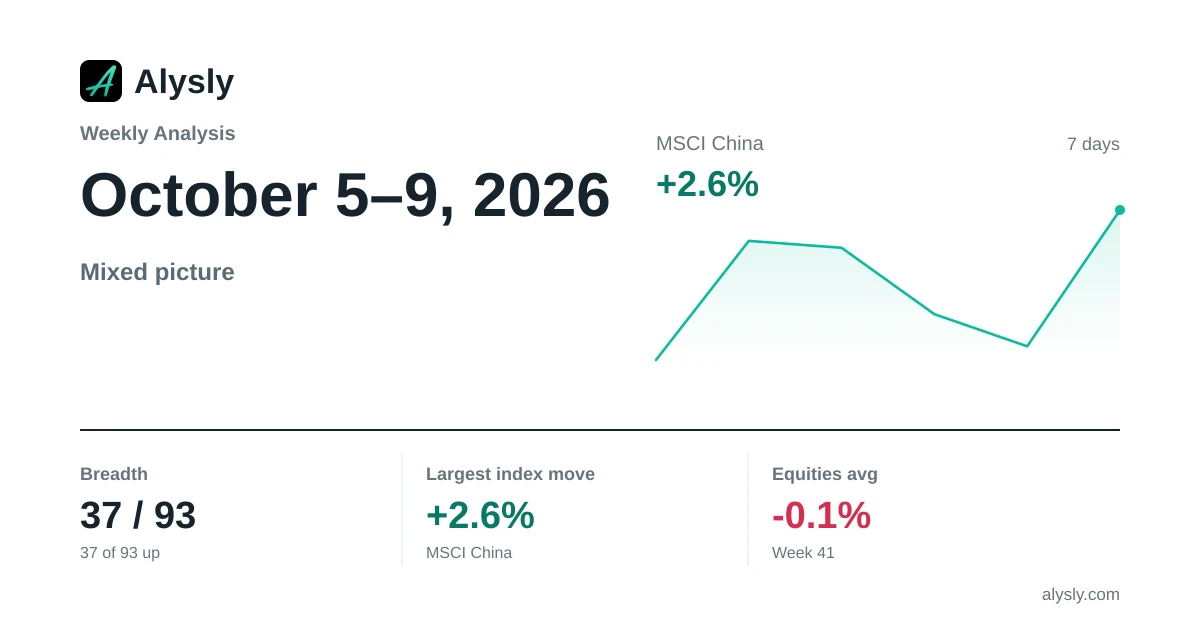 · Mixed
Weekly Analysis: MSCI China Leads the Week (+2.6%) · October 5–9, 2026
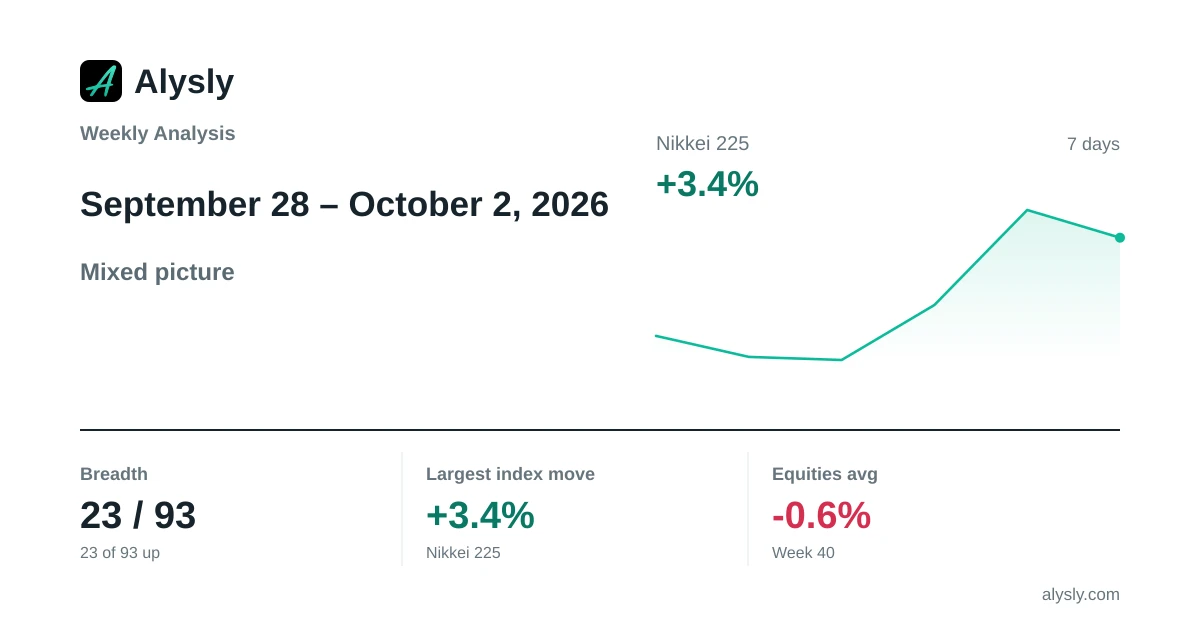 · Mixed
Weekly Analysis: Nikkei 225 Sets the Tone for the Week (+3.4%) · September 28 – October 2, 2026
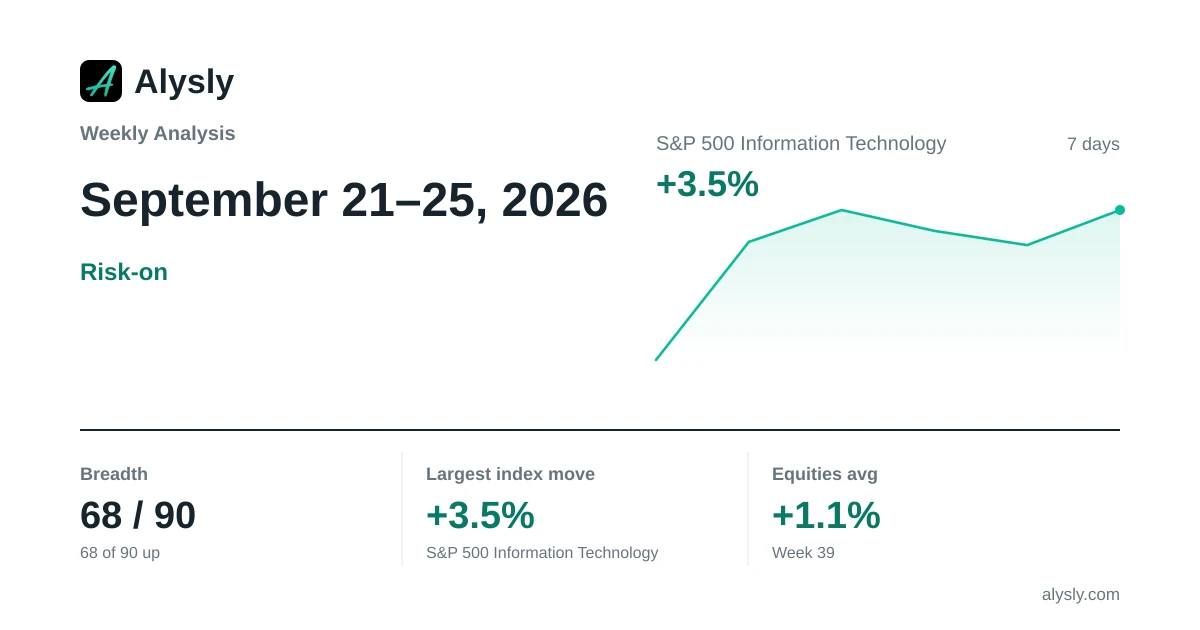 · Risk-on
Weekly Analysis: S&P 500 Information Technology Leads the Week (+3.5%) · September 21–25, 2026