Hedera Is the Day's Biggest Loser, Down 16.1% – September 29, 2026
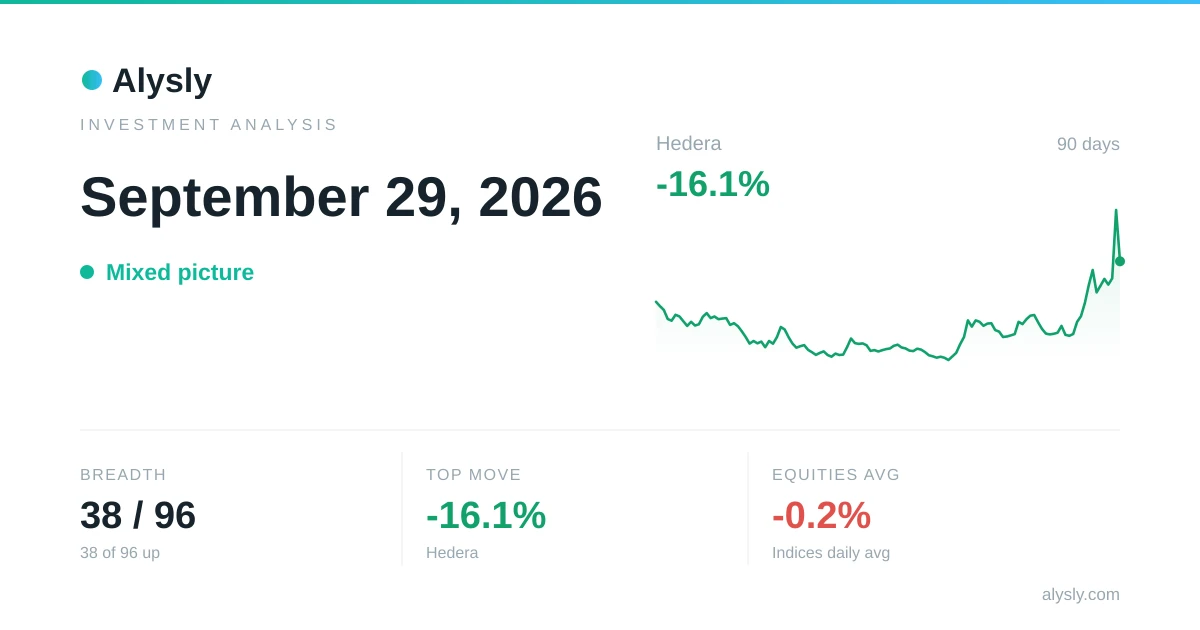
Wrapping up the session on September 29, 2026, the markets tracked by Alysly showed a mixed picture: 38 of 96 monitored assets (40%) closed higher. Leading the day's moves was the crypto asset Hedera at -16.1%. The major equity indices moved -0.2% on average, with the crypto market at +0.6%. Notably, equities and crypto diverged, moving in opposite directions on the day.
The key points at a glance
- Breadth: 38 of 96 assets higher (40%), a mixed picture.
- Biggest daily move: Hedera at -16.1%.
- Indices: 3 of 18 higher, strongest MSCI EM IMI (+0.33%), weakest MSCI China (-0.84%).
- Asset classes: leading crypto (+0.6%), lagging commodities (-1.2%).
- Crypto: top gainer PUMP (+19.5%), top loser Hedera (-16.1%).
- Correlation: EUR/USD ↔ Gold at +0.52 (moderately correlated).
- Real assets: top hammer price Porsche 911 Turbo (930) · 1975–1989 at $161,000 (Classic cars).
A single trading day is only a small slice: over longer periods, asset classes, regions and holding period shape a portfolio's result more than any one day's move.
Alysly Analysis: Market Report
Market Barometer
Breadth = share of all tracked instruments (indices, liquid crypto, commodities, forex) with a positive daily change. Bars scale with the magnitude of each asset class's average daily return.
In Focus: Hedera
At -16.1%, Hedera was the day's most notable single move. The chart shows its trajectory over the selected range:
Reported Stock Trades, Last 7 Days
In the 7 days before this report, executives and directors filed 94 open-market transactions above one million dollars: $179.9m in purchases, $590.1m in sales. Filings are due within two trading days.
| Stock | Person | Type | Value |
|---|---|---|---|
| Broadcom Inc. AVGO | SAMUELI HENRY | Sell (plan) | $81.8M |
| Broadcom Inc. AVGO | SAMUELI HENRY | Sell (plan) | $66.3M |
| LENNAR CORP /NEW/ LEN | BERKSHIRE HATHAWAY INC | Buy | $43.5M |
| LENNAR CORP /NEW/ LEN | BERKSHIRE HATHAWAY INC | Buy | $32.2M |
| Broadcom Inc. AVGO | SAMUELI HENRY | Sell (plan) | $30.4M |
Cross-Asset Correlations
Over the past 90 trading days, EUR/USD and Gold were moderately correlated, with a correlation coefficient of +0.52. A value near +1 means they move together, near −1 they move opposite, near 0 there is no linear link. For portfolio diversification, low or negative correlations are valuable because they smooth out volatility.
| Pair | r (90d) | −1 … +1 |
|---|---|---|
| S&P 500 ↔ Bitcoin | +0.38 | |
| S&P 500 ↔ Gold | +0.40 | |
| Gold ↔ Crude oil (WTI) | -0.13 | |
| EUR/USD ↔ Gold | +0.52 |
Data and Charts: Market Report
Indices on the Day
Every index we track is listed in the index overview.


Of the 18 benchmark indices tracked, 3 finished the day higher, so the majority slipped. MSCI EM IMI led the field at +0.33%, while MSCI China trailed at -0.84%. The “52W” column shows where each index sits within its yearly range. A marker far to the right means it is trading close to its 52-week high.
Crypto: Daily Gainers & Losers
From the 50 largest crypto assets by trading volume, excluding illiquid micro-caps.
Gainers
 PUMP
PUMP QNT
QNT 0G
0G Aave
Aave ICP
ICP ETHFI
ETHFI Hedera
 MARSCOIN
 DASH
DASH GRAM
GRAM Chainlink
 ZEC
ZEC+0.6%, moving against equities. PUMP at +19.5%, with Hedera trailing at -16.1%. Crypto remains the most volatile asset class covered here. Daily swings of this magnitude are normal and say little about the long-term trend.
Commodities & Precious Metals
All series: commodities and precious metals.
Precious metals averaged -1.0%, energy and industrial commodities -1.2%. Both groups declined. Gold is a traditional hedge, while crude oil and copper act as growth barometers.
| Name | Price | Change |
|---|---|---|
| Gold | 4179.7 | +0.27% |
| Silver | 61.153 | -0.92% |
| Platinum | 1701 | -2.50% |
| Palladium | 1213.7 | -0.76% |
| WTI crude | 89.38 | -3.48% |
| Brent crude | 96.16 | -1.71% |
| Gasoline | 3.1323 | -0.81% |
| Heating oil | 4.51 | +0.33% |
| Copper | 6.6035 | -0.45% |
Foreign Exchange (Forex)
All currency pairs are listed in the forex overview.
The key pair EUR/USD moved -0.25%: the US dollar firmed against the euro, showing relative strength. A firmer dollar tends to weigh on commodities and emerging markets, a weaker one supports them. Prices are drawn from CME FX futures.
| Pair | Price | Change |
|---|---|---|
  EUR/USD EUR/USD | 1.1377 | -0.25% |
 GBP/USD GBP/USD | 1.3233 | -0.24% |
 USD/JPY USD/JPY | 156.262 | -0.10% |
 AUD/USD AUD/USD | 0.69775 | -0.50% |
 USD/CAD USD/CAD | 1.41253 | +0.05% |
 USD/CHF USD/CHF | 0.826207 | +0.22% |
Real Assets: New Hammer Prices
Since September 22, 2026 the database has logged 3 new auction records. Unlike stocks or crypto, real assets are not quoted continuously. Every figure in this section is a price someone actually paid.
| Asset class | Records | Median | Highest hammer price | Price |
|---|---|---|---|---|
| Classic cars | 3 | $85,000 | Porsche 911 Turbo (930) · 1975–1989 Sep 26, 2026 | $161,000 |
Median = the middle hammer price among this window's records, not the value of a fixed position. It moves simply because different items come up for sale each week. The price index below avoids exactly this composition effect. Prices are hammer prices including the buyer's premium.
Nothing was sold at auction in trading cards in this window. The last sale on file is 8 days old (September 21, 2026). Where trading is rare and expensive, gaps like this belong to the market rather than to a failed fetch. No hammer price was recorded in watches in this window. The latest record stems from September 17, 2026, so 12 days ago. In a thinly traded collectors' market such a pause is normal, not a missing update.
The trading-card price index stands at 604.5, +234.3% against a year ago (base 100 at the first quarter covered, as of September 21, 2026). It measures price changes of the same good rather than the median of a changing offer. Against the previous reading (June 29, 2026) that is +7.7%, a quarterly figure rather than a daily one.
Residential Property: An Official Index, Not a Hammer Price
For residential property there are no individual sales to report: prices there are formed in statistics, not under the hammer. The latest available reading is June 1, 2026, 120 days before this report. The gap reflects the publication lag of the sources rather than missing data.
| Series | Level | Prior print | 1 year |
|---|---|---|---|
| United States (Case-Shiller) Jun 1, 2026 | 336.7 | +0.4% | +1.7% |
| Germany Mar 31, 2026 | 153.4 | +0.3% | +1.4% |
| Euro area Mar 31, 2026 | 157.4 | +0.9% | +4.6% |
Related Content: Market Report
Latest Investment Analysis
 · Risk-off
Hedera Surges 27.3% – September 28, 2026
 · Risk-on
Crypto, Commodities & FX This Week: Bitcoin Cash +35.8% · September 21–25, 2026
 · Risk-on
The Week in Markets: S&P 500 Information Technology Leads the Week (+3.5%) · September 21–25, 2026
 · Risk-on
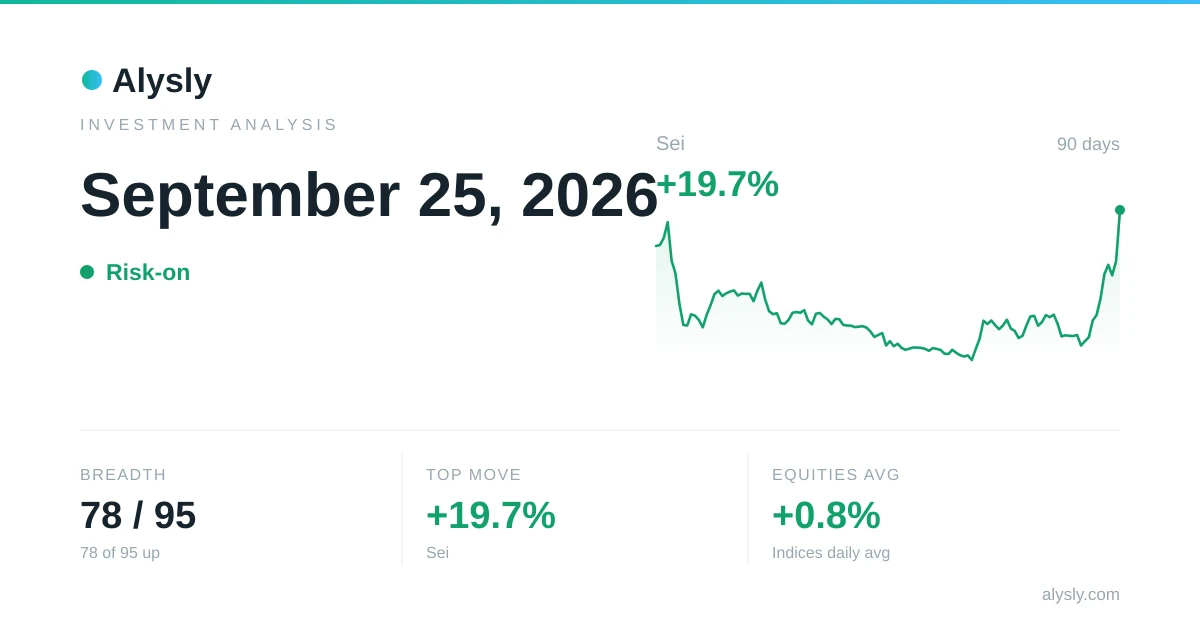
Sei Surges 19.7% – September 25, 2026
 · Mixed
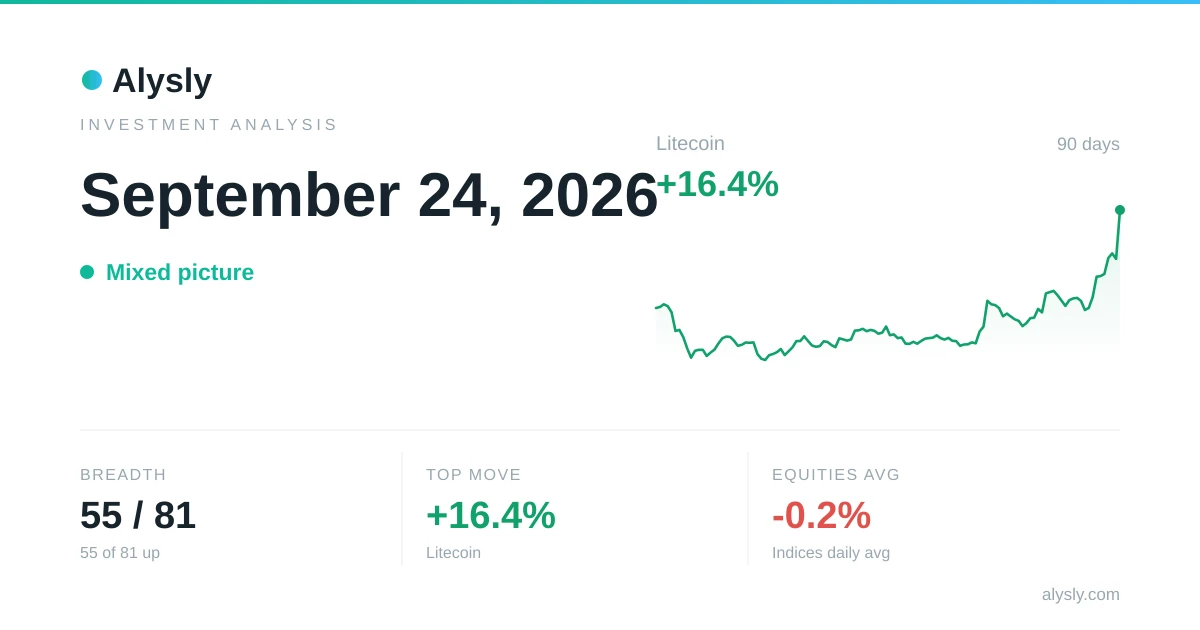
Litecoin Climbs 16.4% – September 24, 2026