Crypto, commodities & FX this week: Bitcoin Cash +35.8% · September 21–25, 2026
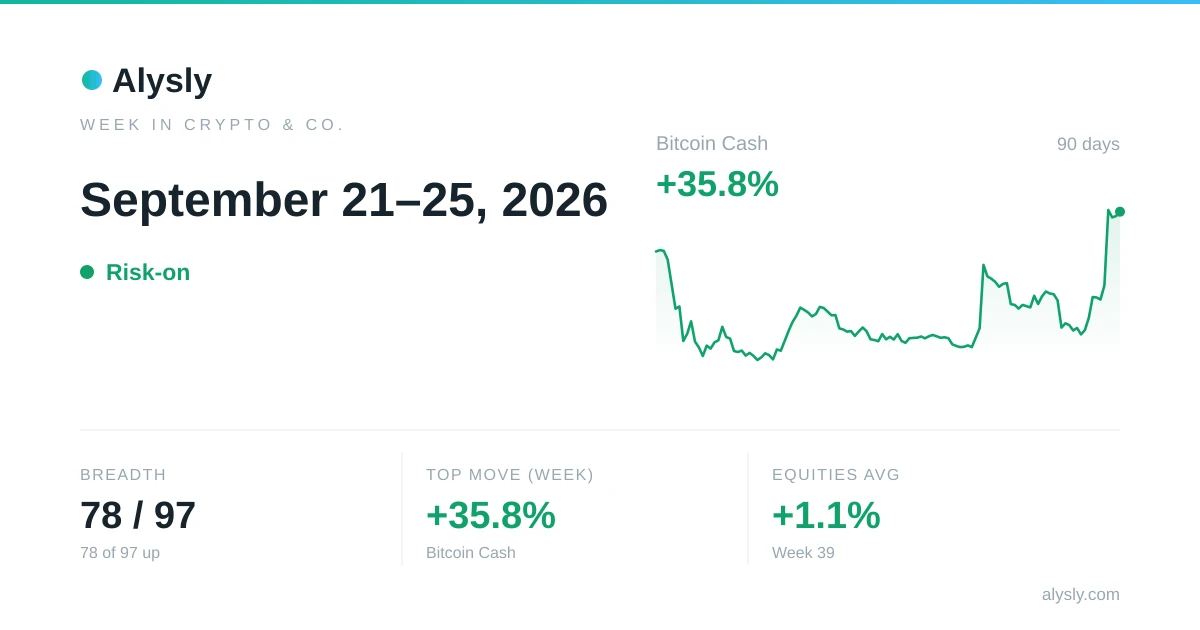
The second part of the weekly review for September 21–25, 2026 looks at crypto, commodities and FX. Crypto moved +16.0 % on average for the week, led by PHA (+130.0 %). Precious metals came in at -2.7 %, energy and industrial commodities at +8.0 %.
Crypto: weekly gainers & losers
Gainers
 PHA
PHA MUBARAK
 QNT
QNT FET
FET ZRO
ZRO Bitcoin Cash
 Avalanche
 SAGA
SAGA XTZ
XTZ TRON
TRON PUMP
PUMP U
UCommodities & metals over the week
| Name | Price | Change |
|---|---|---|
| Gold | 4,321.20 | -1.58 % |
| Silver | 64.8010 | -4.73 % |
| Platinum | 1,797.70 | -1.25 % |
| Palladium | 1,276.00 | -3.30 % |
| WTI crude | 92.4100 | +36.66 % |
| Brent crude | 97.4400 | -0.22 % |
| Gasoline | 3.1875 | +10.07 % |
| Heating oil | 4.4621 | -7.89 % |
| Copper | 6.7660 | +1.11 % |
FX over the week
| Pair | Price | Change |
|---|---|---|
  EUR/USD EUR/USD | 1.1437 | -0.75 % |
 GBP/USD GBP/USD | 1.3257 | -1.04 % |
 USD/JPY USD/JPY | 156.15 | +0.32 % |
 AUD/USD AUD/USD | 0.7020 | -1.35 % |
 USD/CAD USD/CAD | 1.4089 | +1.11 % |
 USD/CHF USD/CHF | 0.8207 | +0.82 % |
Real assets: the week's hammer prices
The week produced 59 new hammer prices. Real assets are not quoted continuously. Trading happens when a lot is called. What follows is therefore not a weekly return but the sum of what actually changed hands.
| Asset class | Records | Median | Highest hammer price | Price |
|---|---|---|---|---|
| Trading cards | 56 | $6,900 | Crystal Charizard #146 · Skyridge (2003) 21 Sep 2026 | $192,000 |
| Classic cars | 3 | $125,000 | Porsche 911 Turbo (930) · 1975–1989 26 Sep 2026 | $161,000 |
Nothing was sold at auction in watches over the week. The last sale on file is 8 days old.
The trading-card price index stands at 604.5 (as of 21 September 2026), +234.3 % against a year ago. It measures price changes of the same good, unlike a median, which is made up of different items every week.
Residential property has no weekly figure: the latest official reading is from 1 June 2026, 116 days before this review. United States (Case-Shiller) +1.7 % year on year. Germany +1.4 % year on year. Euro area +4.6 % year on year.
Cross-asset correlations
| Pair | r | −1 … +1 |
|---|---|---|
| S&P 500 ↔ Bitcoin | +0.39 | |
| S&P 500 ↔ Gold | +0.40 | |
| Gold ↔ Crude oil (WTI) | -0.13 | |
| EUR/USD ↔ Gold | +0.54 |
Latest Investment Analysis
 · Risk-on
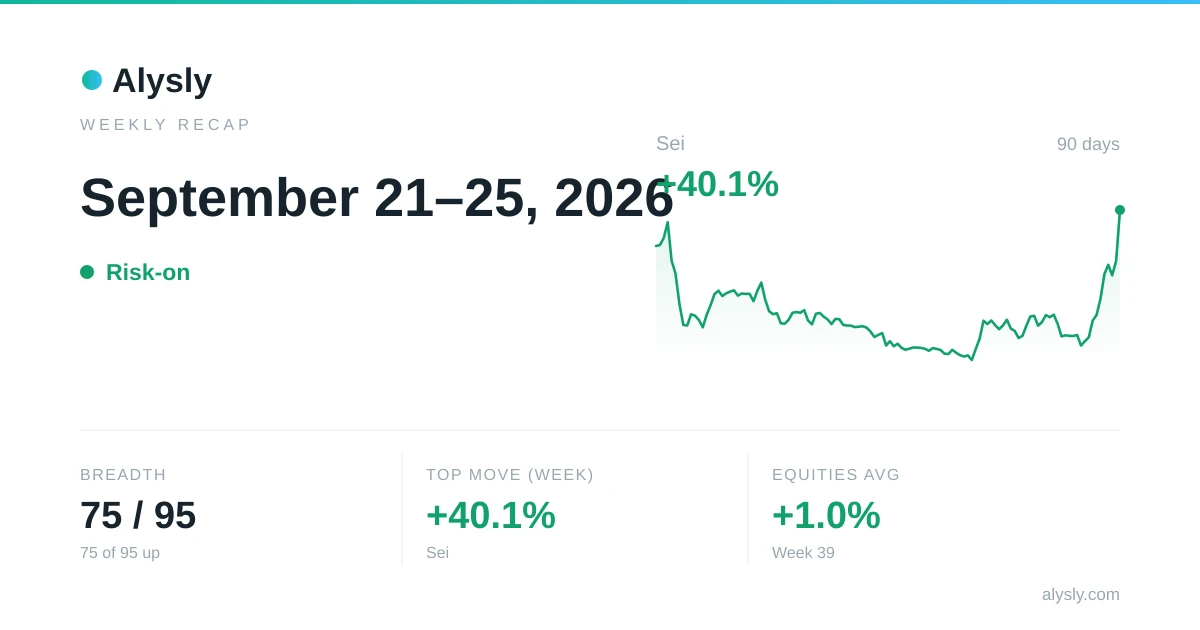
The week in markets: S&P 500 Information Technology leads the week (+3.5%) · September 21–25, 2026
 · Risk-on
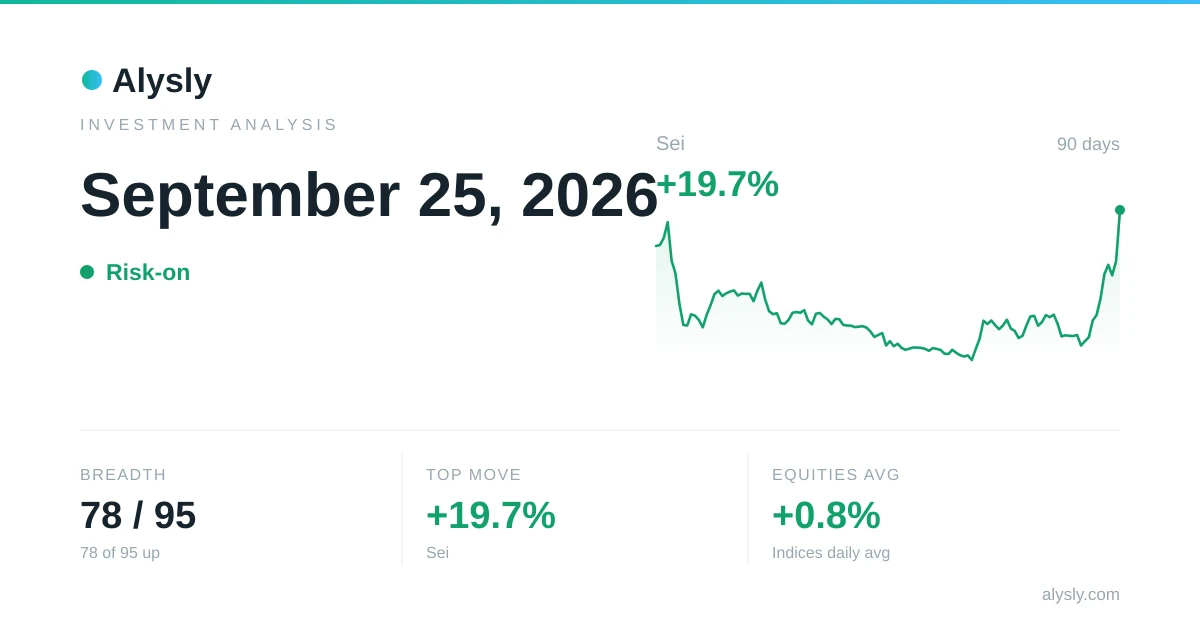
Sui surges 17.8% – September 25, 2026
 · Mixed
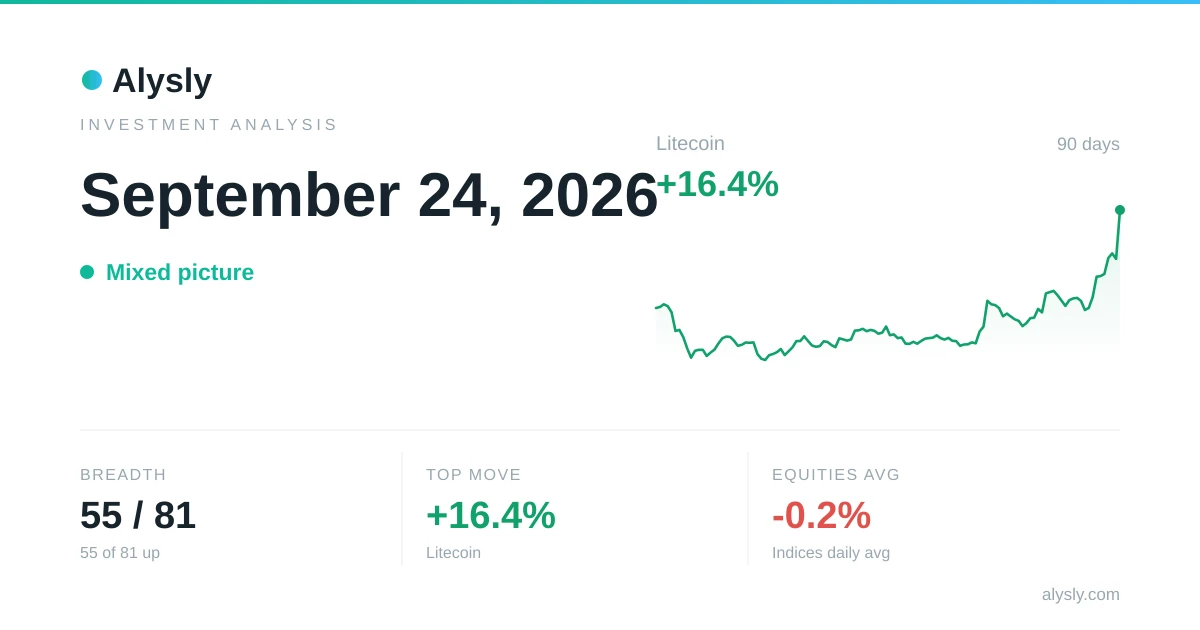
Litecoin climbs 16.4% – September 24, 2026
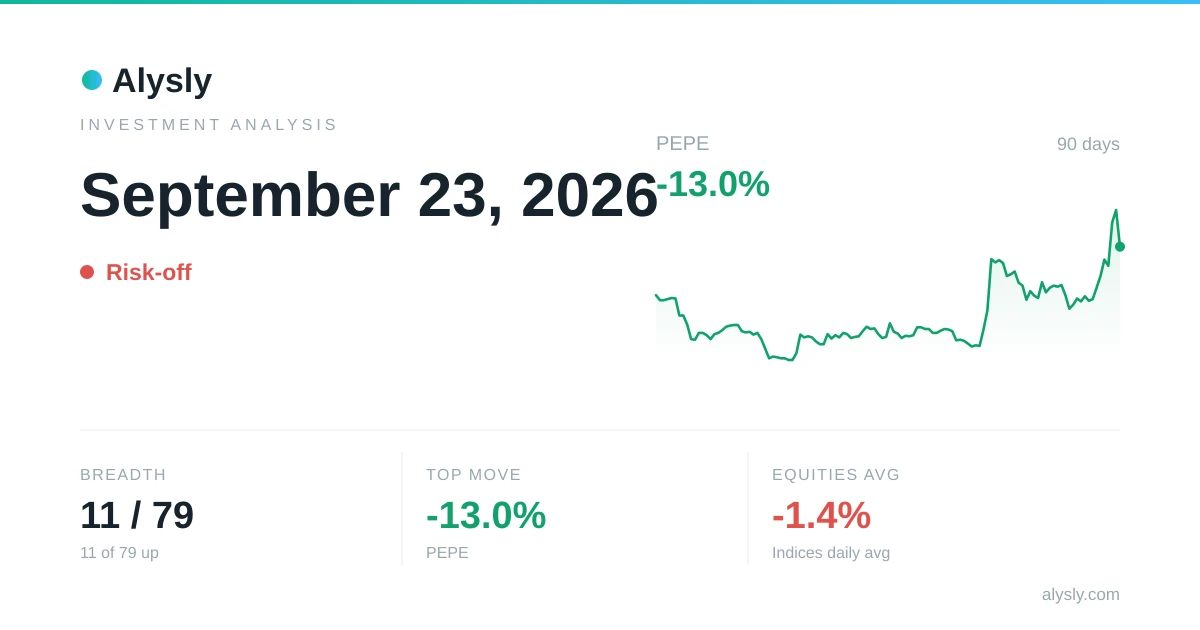 · Risk-off
Red across the board: only 16 of 93 assets hold gains – September 23, 2026
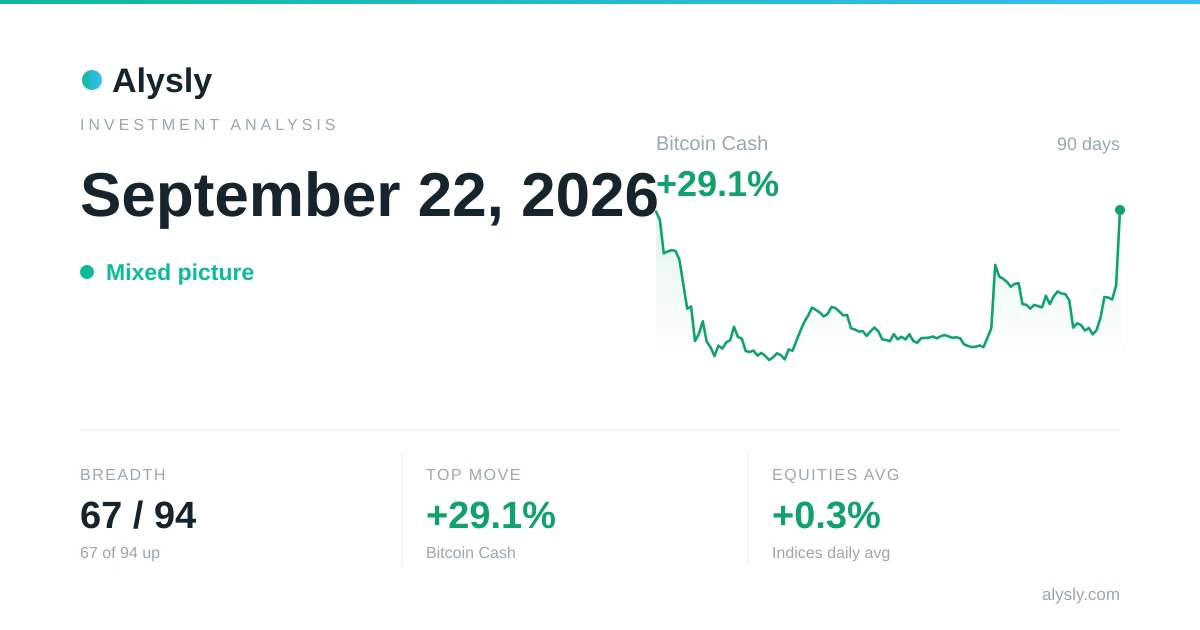 · Mixed
Bitcoin Cash surges 29.1% – September 22, 2026