The Week in Markets: Nikkei 225 Sets the Tone for the Week (+3.4%) · September 28 – October 2, 2026
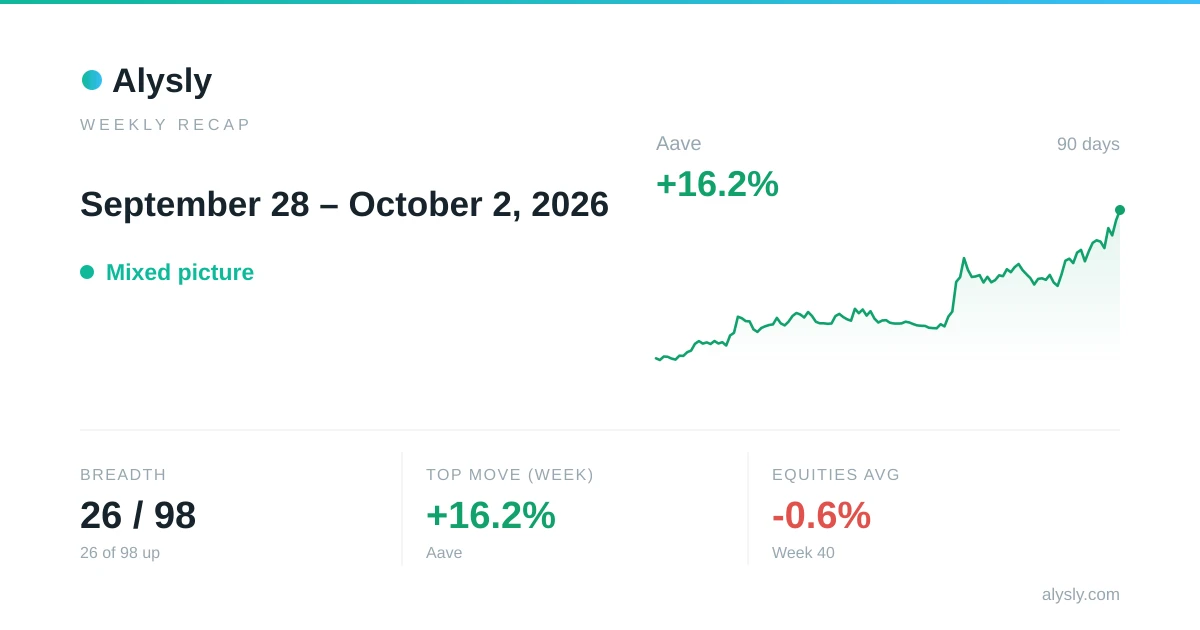
The trading week of September 28 – October 2, 2026 in review: 28 of 98 tracked assets (29%) finished the week higher, with the major equity indices moving -0.6% on average over the week. This part focuses on equities and benchmark indices; crypto, commodities and FX follow on Sunday.
Weekly Barometer
Weekly change = weekend close versus roughly five trading days earlier.
Indices Over the Week


Stocks: Weekly Gainers & Losers
Gainers
| Name | Price | Change |
|---|---|---|
| Wolfspeed, Inc. WOLF | $35.28 | +27.97% |
| Carnival Corp Ltd. CCL | $25.76 | +15.78% |
| Lumentum Holdings Inc. LITE | $1,085.42 | +15.27% |
| Synopsys Inc. SNPS | $489.90 | +15.06% |
| Royal Caribbean Group RCL | $277.74 | +14.44% |
| Coherent Corp. COHR | $337.04 | +13.93% |
| United Therapeutics Corporation UTHR | $541.70 | +13.93% |
| Accenture plc Class A ACN | $198.90 | +12.94% |
Losers
| Name | Price | Change |
|---|---|---|
| Banzai International, Inc. PARA | $0.5224 | -25.37% |
| Nektar Therapeutics NKTR | $43.58 | -23.62% |
| Fair Isaac Corporation FICO | $661.25 | -23.39% |
| VNET Group ADR VNET | $5.13 | -22.74% |
| Solidion Technology Inc. STI | $5.31 | -18.56% |
| Lufax HLDG American Depositary Sha LU | $1.02 | -17.07% |
| Clarivate plc CLVT | $1.48 | -16.85% |
| Cable One, Inc. CABO | $12.21 | -16.66% |
From the US stocks Alysly charts. Weekly swings in single names can be far larger than those of the indices.
Latest Investment Analysis
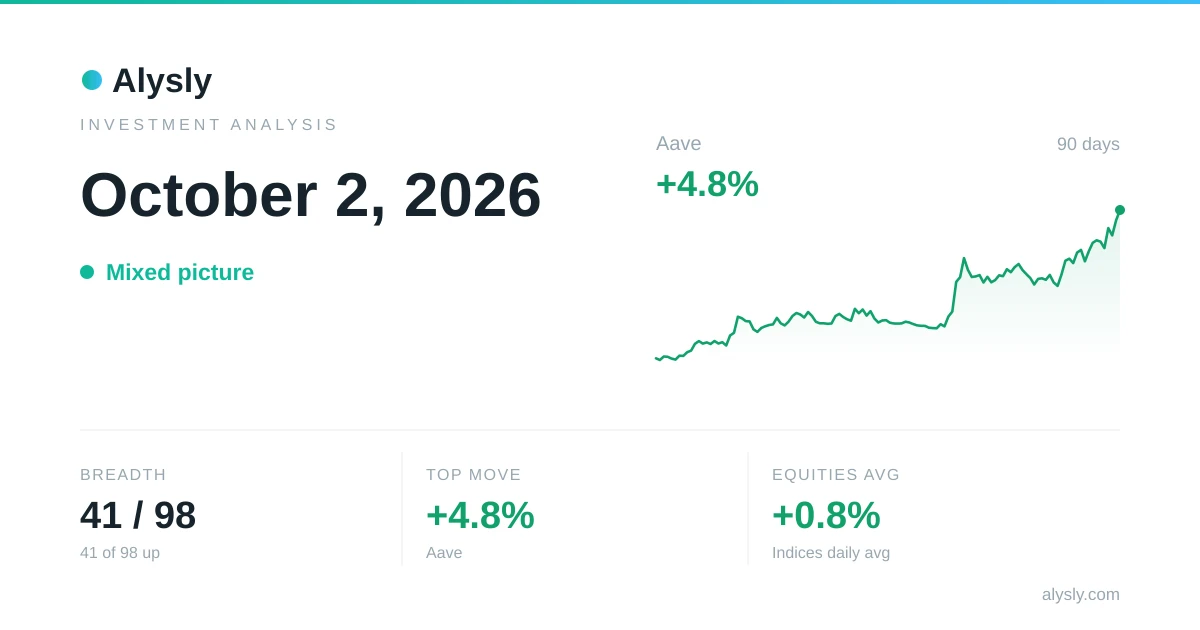 · Mixed
MSCI Japan Tops the Major Indices at +1.6% – October 2, 2026
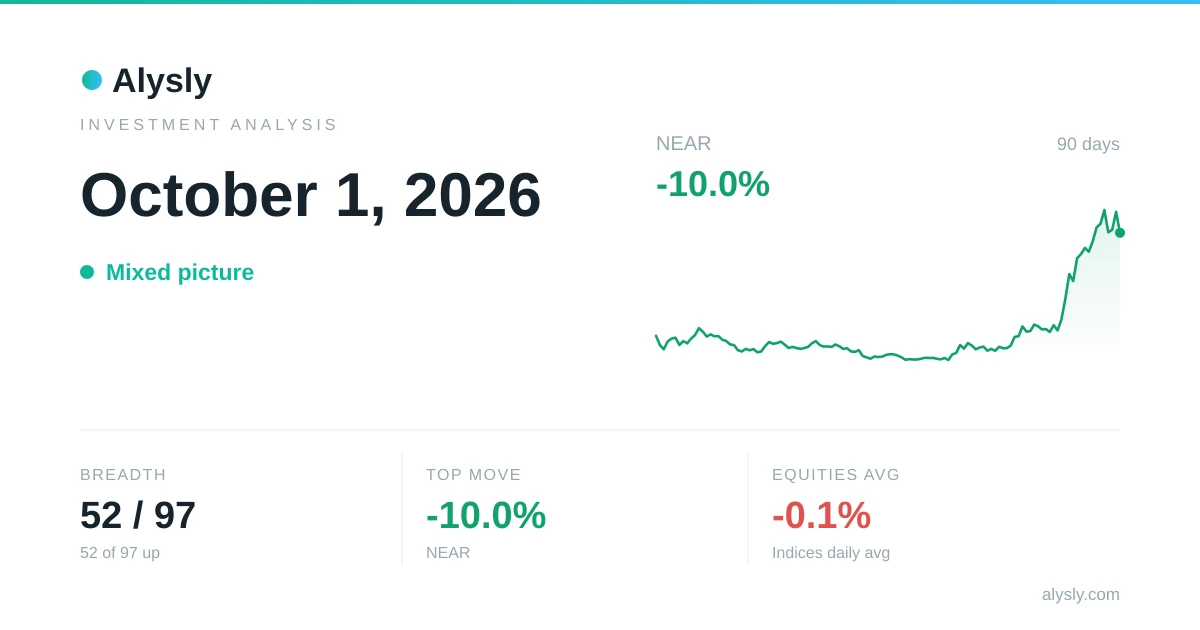 · Mixed
Nikkei 225 Leads Global Indices, +3.3% – October 1, 2026
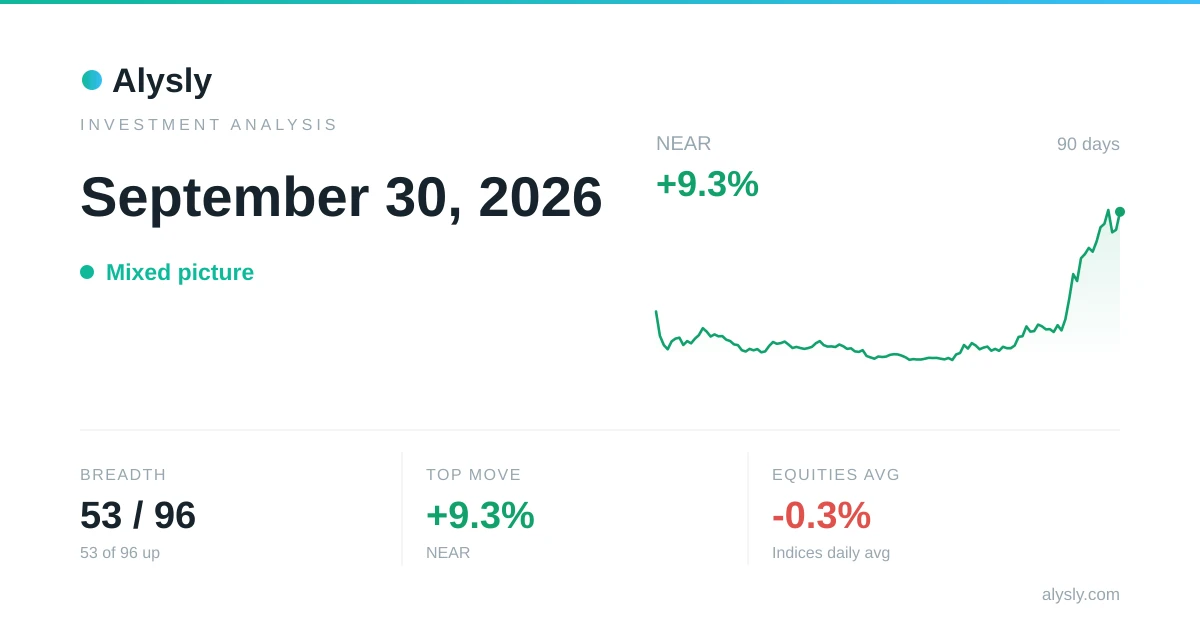 · Mixed
STX Climbs 17.4% – September 30, 2026
 · Mixed
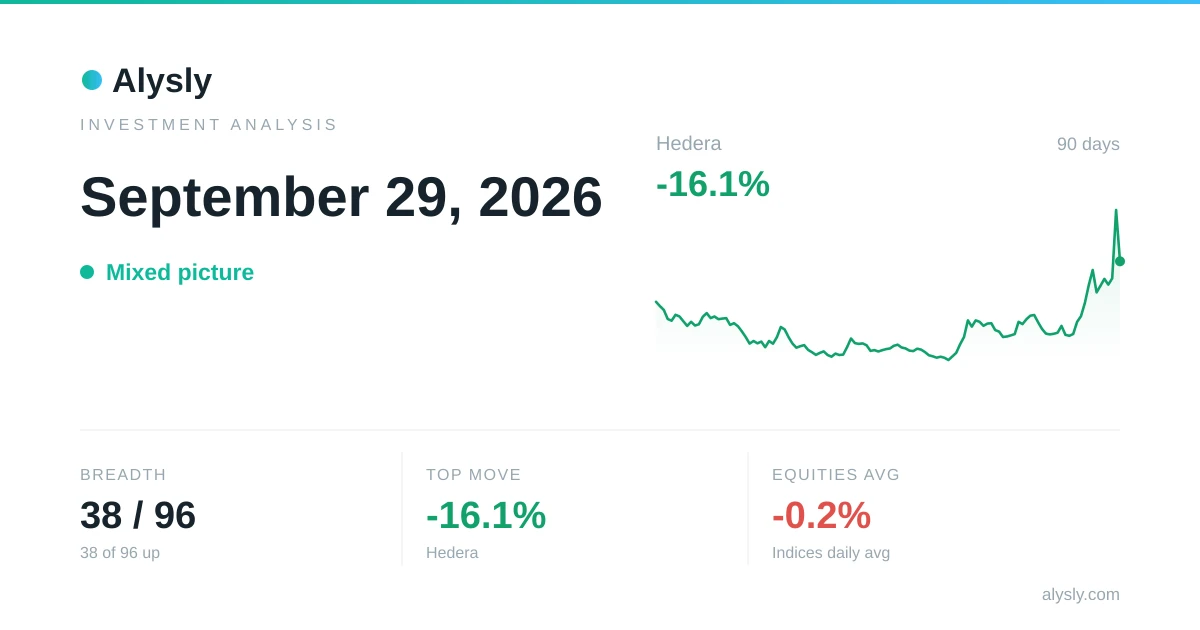
Hedera Is the Day's Biggest Loser, Down 16.1% – September 29, 2026
 · Risk-off
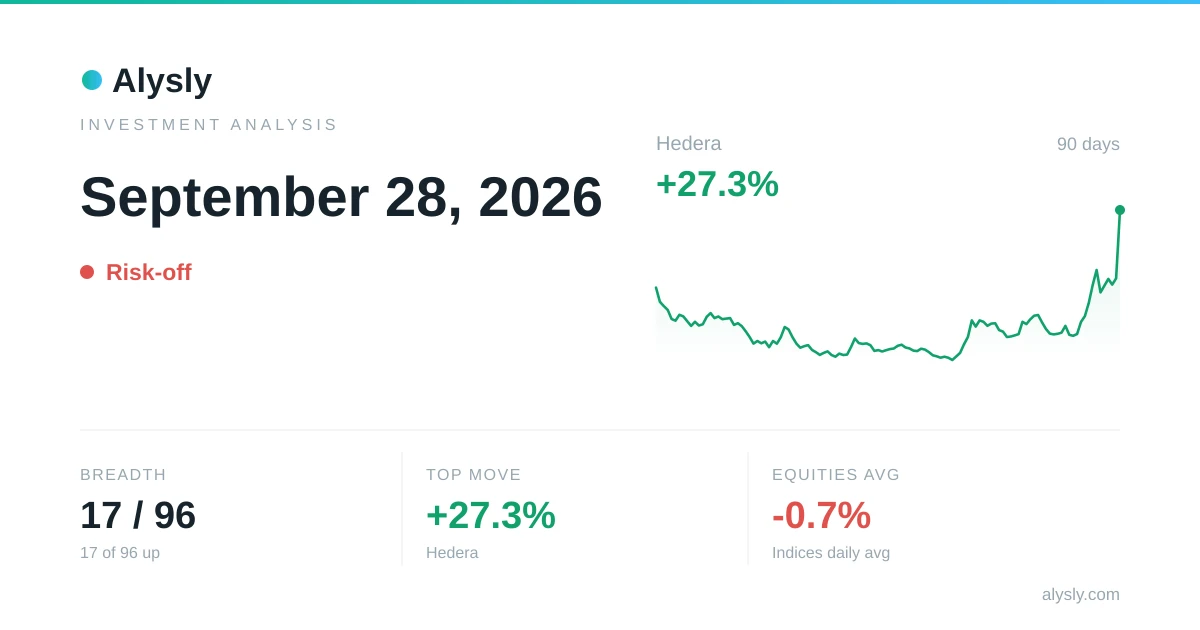
Hedera Surges 27.3% – September 28, 2026