Why Most Traders Lose Money — and What the Data Shows
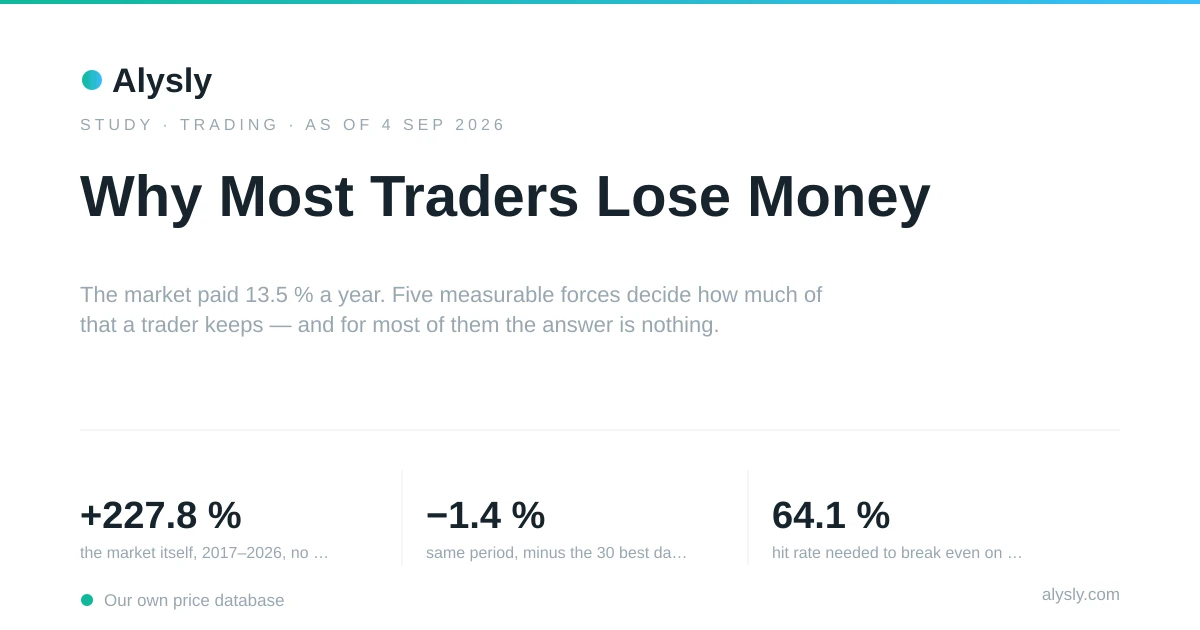
Trading is usually described as a contest of skill. The data suggests that much of the outcome is decided before skill even comes into play. Between April 2017 and September 2026, the US equity market returned 13.5% per year to anyone who simply held their position. This study measures five reasons why so little of that return reaches active traders.
- +227.8%the market itself, 2017–2026, no trading
- −1.4%same period, minus the 30 best days
- 64.1%hit rate needed to break even on daily trades — the market itself managed 54.5%
- 94.9%forced close-outs within a year at 30× leverage
The Market Did the Work
Almost every discussion about trading eventually turns into a discussion about ability. One side believes that reading charts, timing entries and cutting losses can be learned. The other believes they cannot. Both sides often skip the question that should come first: what did the market actually return during the period, and what does it cost to try to capture that return?
That first number is easy to establish. Between April 3, 2017 and September 4, 2026, across 2,365 daily closes, the S&P 500 futures contract gained 227.8%. Annualized, that equals 13.5% per year. Capturing this return required one decision at the beginning and no further decisions afterward.
That figure is a floor, not an estimate of the full market return. It is a price series without dividends, and two independent checks show that it understates the market it represents. It trails the ETF tracking the same index by 0.7 percentage points per year and the NAV performance of an S&P 500 ETF in our own fund data by 1.2 percentage points. Every comparison that follows therefore gives the trader the benefit of the doubt.
The market return was substantial, so any explanation for poor trading results has to show where a return of that size disappears. Five forces account for much of the difference. None requires the trader to be wrong about the market, and all five can be measured with our own price data.
Before looking at the first one, it helps to define what type of trading we are measuring. The answer affects the size of almost every number that follows.
Which Trading This Study Covers
Day trading, swing trading and position trading differ in many ways, but only one factor can be measured directly here: how long a position is held. Everything else, including trading costs, the number of round trips and the size of a typical gain or loss, follows from that holding period.
Our database contains daily closing prices, so holding periods from one session to a full quarter can be measured. Anything that happens within a single day cannot. Intraday trading is therefore outside the scope of this study, and nothing below should be read as a statement about it.
For each holding period, the market’s own history answers three questions. How often was a long position profitable at the end of the window? How large were the average gain and average loss? And what hit rate would a trader need to break even after paying 0.2% in costs per round trip?
Loading figure …
| Holding period | Market up | Hit rate needed | Gap | Round trips a year | Cost per year |
|---|---|---|---|---|---|
| 1 day | 54.5% | 64.1% | +9.6 pp | 252 | 39.6% |
| 1 week | 60.8% | 58.5% | −2.3 pp | 50 | 9.6% |
| 2 weeks | 65.4% | 58.0% | −7.3 pp | 25 | 4.9% |
| 1 month | 68.7% | 55.4% | −13.3 pp | 12 | 2.4% |
| 1 quarter | 75.4% | 50.2% | −25.1 pp | 4 | 0.8% |
The pattern is clear. At a one-day horizon, the required hit rate of 64.1% is 9.6 percentage points higher than the 54.5% the market itself achieved. A trader therefore starts the daily game with a gap that skill must overcome before the strategy can break even.
Extend the holding period to one week, and the relationship reverses: the required rate of 58.5% is below the 60.8% that simply being invested produced. At a quarterly horizon, the gap has grown to 25 percentage points in favor of the trader, while the annual cost burden has fallen from 39.6% to 0.8%.
Two conclusions follow. First, the shorter the holding period, the more skill becomes a requirement rather than an advantage. Second, when this study talks about traders losing money, it mainly refers to the faster end of the scale: daily and weekly holding periods, where the hurdle is highest. Position trading over months and quarters faces the same arithmetic, but much less severely.
Losses Cost More Than They Look
The first force is simple arithmetic, and it is one of the easiest to underestimate. Percentages do not work the same way in both directions. A position that falls by 20% needs a 25% gain to return to its starting point. A position that falls by half needs to double. After a 70% decline, it takes a 233% gain just to get back to the starting level.
Every further step down therefore widens the gap between what was lost and what is needed to recover it.
Loading figure …
The spring of 2020 shows what this means in practice. The market fell 34.4% between February 19 and March 23. To return to its previous level, it needed a gain of 52.5%, which it reached on August 21, 184 days after the peak. An investor who held through the decline recovered the full loss. An investor who sold at the bottom locked in the loss and left the recovery to someone else.
Individual stocks show the same mechanism in a more extreme form. Of the 813 companies in our sample, 44.5% trade more than 20% below their own two-year high, and 8.4% are down by more than half. The median company would need a gain of 20.7% just to return to a level it has already reached.
The true figures are likely worse. The sample cannot include companies that failed, and 49 further series had to be removed because unadjusted stock splits cannot be told apart from crashes in a price series. Removing these cases also removes some genuine crashes.
This is why risk control is not simply a question of temperament. Accepting a deep drawdown means taking on a recovery task whose cost rises faster than the loss that created it.
The Return Lives in a Handful of Days
If the market pays well over nine years, the obvious idea is to stay invested during the good periods and avoid the bad ones. The data gives a clear answer to that idea, starting with how unevenly returns are spread over time.
Loading figure …
Of the 2,364 daily moves in the series, removing the ten strongest leaves a return of +77.7%, compared with +227.8% for the full period. Remove the twenty strongest and only +29.0% remains. Remove the thirty strongest, just 1.3% of all sessions, and nine years in a rising market end at −1.4%.
The mirror image is just as striking, and it deserves attention because it is the strongest argument for market timing. Without the ten worst days, the same period would have returned +531.4%.
If the two groups could be separated, timing would be one of the most valuable skills in finance. They cannot be separated, and that is the important finding.
Fourteen of the twenty best days occurred within ten trading days of one of the twenty worst days. They cluster in the same periods, including March 13 and March 24, 2020, April 6, 2020, and April 9, 2025, because sharp recoveries are often part of sharp declines. They are not separate events that happen later, once markets have calmed down.
The practical consequence is uncomfortable. Selling after a sharp fall is one of the most natural reactions, but it is also one of the most reliable ways to miss a rebound. Avoiding the worst days while staying invested for the best ones sounds like a timing strategy. In practice, the two goals conflict.
A High Hit Rate Proves Less Than It Seems
Traders who keep records usually track their hit rate: the share of positions that end in profit. It is intuitive, but it contains less information than its popularity suggests.
Over the nine years, 54.5% of all sessions closed higher than the previous day, so the market rose more often than it fell. The average winning day, however, gained 0.75%, while the average losing day lost 0.77%. The ratio between the two, known as the payoff ratio, was 0.96: gains were slightly smaller than losses.
Direction alone therefore produces no return. What produces the return is the size of individual moves, and those moves are distributed in a way that many trading rules do not capture.
Loading figure …
Days more than four standard deviations from the mean make up 0.63% of the series. Under a normal distribution, they would account for roughly 0.01%, so they occur about sixty times more often than a normal model would suggest. The measured kurtosis is 17.0, compared with 3 for a normal distribution, while a skewness of −0.29 shows that the extremes lean slightly to the downside.
A position size that survives 99 days out of 100 is therefore not necessarily conservative when the remaining day can carry this much risk.
Loading figure …
The same pattern appears when the question moves from days to companies. Across the 813 stocks, the correlation between the share of winning days and total return is 0.43, while the rank correlation is 0.65.
The two measures therefore move together, which is not surprising: a stock that rose over two years necessarily had more up days than down days. What the numbers do not support is the reverse reading, that a high hit rate produced the result. The gap between the two measures shows why. The rankings agree fairly well, while the linear relationship is weaker, because some of the largest gains come from companies whose hit rate was not especially high.
At the level of the market itself, the hit rate is even less useful on its own. There, a payoff ratio of 0.96 means that being right more often than wrong did not produce a positive return by itself.
The same sample also answers a question most investors ask sooner or later: whether picking individual stocks is worth the effort. The median company returned 18.1% over its period. Compared with the index over exactly the same window, only 35.2% of the companies beat it, while the average return of +43% is lifted by a small group of extreme winners.
Stock picking is therefore not a coin flip with even odds. It is a distribution in which the typical outcome is well below the average, and missing the few extreme winners is a normal outcome rather than bad luck.
Costs Decide What Is Left
So far, nothing has been traded. Now assume a trader who neither adds skill nor destroys value: they earn the same gross return of 227.8%, but collect it through a certain number of round trips per year, each costing 0.2% of the position.
Loading figure …
| Trades per month | Nine-year result | Per year |
|---|---|---|
| 0 | +227.8% | 13.5% |
| 1 | +161.6% | 10.8% |
| 2 | +108.8% | 8.2% |
| 5 | +6.2% | 0.6% |
| 10 | −65.6% | −10.8% |
| 20 | −96.4% | −29.8% |
Five round trips a month sounds modest, and it is: roughly one position closed and reopened each week. At that pace, nine years of a rising market leave +6.2%.
Over the same 112 months, German overnight deposits paid 1.81% in total. The index figures are in dollars and the deposit rate is in euros, so a fair comparison needs a conversion: in euro terms, the same index period returned +200.7%. The trader therefore stays ahead of a savings account but keeps less than one thirtieth of what the market provided without trading.
The 0.2% in the table is the cheapest case, not an average. It comes from the lowest fee in our own broker comparison, and the other levels in the figure come from the same source. Trade the same strategy in €500 orders and the cost rises to 0.4% per round trip, turning +227.8% into −65.7% at five trades a month. Trade through a direct bank charging €4.90 plus 0.25% per order, and a €1,000 round trip costs 1.5%. At that rate, even one trade a month is enough to turn +227.8% into −40.2%.
Costs are therefore not a detail to optimize only after a strategy works. At ordinary trading frequencies, they can become the dominant factor, and the choice of broker can change the result more than many changes to the strategy itself.
Without an Edge, Speed Only Shortens the Story
The calculation above still gives the trader the market’s return. The harder question is what happens when the direction of each trade is simply right or wrong at random, which is the fair starting assumption for anyone who has not yet shown otherwise.
Loading figure …
To answer this, we simulated 30,000 accounts. Each trade uses a real daily move from the index series, assigns its direction by coin flip and charges the same 0.2% trading cost. There is no skill in the model, but there is no added incompetence either.
After one year, 24.9% of the accounts trading once a month are ahead. At four trades a month, the figure falls to 10.3%; at ten trades, to 2.6%; and at twenty trades, to 0.2%. Extend the horizon to five years at ten trades a month, and the share of winning accounts rounds to zero, while the median account is down 71.1%.
Drawing single days at random removes something real, because quiet days tend to follow quiet days and violent days tend to cluster. Repeating the whole exercise with five-day blocks, which keeps this clustering, moves the one-year figure at four trades a month from 10.3% to 9.1%. The direction of the result therefore does not depend on the assumption. If anything, the simpler assumption is more favorable to the trader.
It is worth being precise about what happens here. Nobody in this model is punished for a bad forecast, because the forecasts are fair by construction. Frequency alone turns an even game into a near-certain loss, because every trade pays a cost and those costs compound just as returns do.
Loading figure …
This also answers a question that comes up whenever short-term results disappoint: whether things improve with time. For an account without an edge, they do not, and the reason is the same arithmetic seen from a different angle. At four round trips a month, 10.3% of accounts are in profit after one year. After two years, it is 3.8%; after three, 1.5%; after five, 0.3%; and after ten years, the share rounds to zero, while the median account has lost 62.9%.
Time does not average out the trading friction. It compounds it, and the small chance of being ahead shrinks with every year the account keeps trading.
That is also the fair answer to the question of experience. Our data contains prices, not people: we cannot observe how long an individual has been trading, and this study makes no claim about it. What the data does establish is the size of the hurdle that experience would have to clear: 9.6 percentage points of hit rate at a daily holding period, or 12.8 percentage points per year at five round trips a month. An account that does not clear that hurdle can still end up ahead for a while, but only by luck.
Leverage works differently, and the difference is not in the trader’s favor.
Leverage Puts a Deadline on the Trade
Loading figure …
At double leverage, 0.1% of the accounts are forced to close out within the year. At five times leverage, it is 17.6%; at ten times, 56.3%; and at the 30× leverage that all seven CFD providers in our broker comparison still offer, 94.9% of accounts are closed out within twelve months.
The second bar in the figure matters as much as the first. Running the same accounts with no costs at all changes very little: 15.1% instead of 17.6% at five times leverage, and 93.6% instead of 94.9% at thirty times. Unlike the frequency result, this is not mainly about fees. It is the market’s own volatility reaching a position that is too large to survive it. Repeating the exercise with five-day blocks, which keeps calm and volatile periods together, gives almost the same result again: 15.6% and 94.7%.
Leverage therefore does not make anyone more likely to be right. It reduces the amount of market movement an account can survive before the position is closed.
A closed-out account cannot take part in the recovery, and some of the largest single-day gains arrive in the same weeks as the largest declines. The recovery arithmetic from the first section then applies in full, except that there is no position left to recover.
Day Trading as a Full-Time Job
Whether trading can replace a salary is a question of both skill and arithmetic. The hurdle measured above, about 12.8 percentage points a year at five round trips a month, has to be cleared before anything is earned.
Living from trading gains also takes capital. At a net return of 10% a year, which is an assumption and not a forecast, an income of $40,000 before tax requires $400,000 in the account. Every weaker year eats into that capital. How much capital a steady withdrawal needs at realistic returns is calculated in living off investment returns .
Is Day Trading Profitable?
The numbers in this study answer that with a hurdle rather than a yes or no. At five round trips a month, costs take about 12.8 percentage points a year before the trader earns anything above the market’s gross return. Two findings from the analysis add to that hurdle.
A high hit rate is not enough on its own, because the ratio between average gains and average losses also decides the result. And a large share of the market’s return arrives on a handful of days, when a short-term account may not be invested.
Whether an individual trader clears that hurdle cannot be read from market data. The hurdle applies to every account alike; the skill needed to clear it does not.
Day Trading or Long-Term Investing?
They are different sources of return, not two routes to the same result. Long-term investing earns from how companies and markets develop over time and means staying invested through declines. Short-term trading tries to earn from price movements and pays costs every time a position changes.
The calculation above shows how those costs rise with trading frequency, while a long-term portfolio pays far less in transaction costs. Both approaches can exist in the same portfolio, but only short-term trading has to clear the trading hurdle again and again.
Do Day Traders Have to Pay Taxes?
Yes, and the rules depend on the country. In the US, gains on positions held for a year or less are taxed as ordinary income. In Germany, gains are generally subject to a 25% flat tax plus the solidarity surcharge, and losses from selling stocks can only be offset against gains from selling stocks.
What the Numbers Settle, and What They Leave Open
Taken together, the five effects point in the same direction. A loss requires a larger gain to recover. A large share of a decade’s market return is concentrated in days that cannot be identified in advance and that often occur close to the worst days. A good hit rate does not by itself produce a good return, and neither does picking the typical stock. Ordinary costs at ordinary trading frequencies can consume much of a long bull market, while leverage reduces the amount of market movement a position can survive.
None of this proves that profitable trading is impossible. It measures the size of the hurdle before individual ability is considered. At five round trips a month, a trader has to beat the market by about 12.8 percentage points a year just to match someone who did nothing.
Two factors would raise that hurdle further, and both were left out of the calculations. Financing costs on leveraged positions are not modeled, although the US policy rate stood at 3.63% in early September 2026. Taxes on realized gains are not modeled either, and they generally weigh more on frequent trading than on long-term holding. Adding either factor would increase the cost of trading.
Five limitations should stay in view. Nothing here covers intraday trading, because the database contains daily closing prices and the shortest measurable holding period is one session. Nothing here measures individual experience either, since the data contains prices rather than trading accounts; the study can only state the hurdle, not who clears it. The stock sample contains only companies we track, so failed companies are missing, and the 49 series removed for unadjusted corporate actions also remove genuine crashes. The simulations describe a trader without skill, so they are a benchmark, not a portrait of any particular trader. Finally, the analysis covers one stretch of history that happened to include one major crash and one long bull market. Another nine years would produce different magnitudes, even if the arithmetic of costs and recoveries stayed the same.
The most useful finding is also the least exciting. Over these nine years, the decision that produced the best result was the decision to stop making decisions.
Data and Method
- Data basis
- es.f · Apr 3, 2017 to Sep 4, 2026 · 2,365 trading sessions · 813 individual stocks
- Cross-check
- The same price chain against the ETF tracking the same index over exactly the same days: es.f returned 36.92% versus 38.40% for SPY. Across all four index pairs we can test, the chain runs 0.68 percentage points per year below the reference.
- Second cross-check
- The provider-reported NAV performance of an S&P 500 ETF in our own ETF table is 1.12 percentage points per year above our price chain across one, three, and five years, as of Sep 30, 2026. The chain contains no dividends, and roll costs cannot be separated from distributions in this data. Both cross-checks point in the same direction: the buy-and-hold side of this study is understated rather than overstated.
- The index series is the front-month futures chain and is therefore a price series: dividends are not included. Two cross-checks show the size of the gap. Against the ETF tracking the same index over exactly the same days, the chain runs 0.7 percentage points per year lower. The same pattern holds across all four index pairs we can test, with gaps from 0.5 to 0.8 points. Against the NAV performance reported by an S&P 500 ETF in our own ETF table, the gap is 1.2 points per year across one, three, and five years. Roll costs and distributions cannot be separated from this data, but both cross-checks point in the same direction: the buy-and-hold result is understated here, never overstated.
- The stock sample starts with 862 companies that have at least 400 trading days and a current price. We remove 49 because they contain a single-day move beyond ±35%. The price series are not adjusted for corporate actions, so a two-for-one split appears as a 50% crash, and prices alone cannot distinguish the two. In 2026, both a genuine crash and a split produced a factor of 0.49. Removing these cases also removes real crashes, which makes the drawdown figures milder than they would otherwise be. The final sample contains 813 companies. The list of companies is fixed in the repository, so companies added to our database later do not change the result.
- Each company is compared with the index over its own start and end dates because the series do not all begin on the same day. Using one fixed index return would compare different periods.
- The simulated accounts assume no skill at all: real daily index moves, random direction, and real trading costs. They are a null model. With 30,000 paths, the standard error of a share is at most 0.3 percentage points, so the second decimal place would be noise and is not reported.
- Drawing individual days independently destroys volatility clustering, which is important for forced close-outs. Every simulation was therefore repeated by drawing five-day blocks. Both results are shown: 9.1% versus 10.3% of accounts in profit at four round trips a month, and 15.6% versus 17.6% of accounts closed out at five times leverage.
- Costs are charged on the full position at every round trip, and every position is held for one trading day. Financing on leveraged positions is not modeled, although the US policy rate stood at 3.63% on September 4, 2026. Taxes are not modeled either. Both omissions work against the trader, not in their favor.
- Holding-period figures come from overlapping windows, which are not independent observations. The daily row rests on 2,364 sessions, but the quarterly row is based on only about 37 independent quarters. It should therefore be interpreted with appropriate caution.
- All four cost levels come from our own broker comparison : 0.1% is a €0.99 order on €1,000, 0.2% is the €1 flat fee charged on both sides, 0.4% is the same flat fee on a €500 order, and 1.5% is the direct-bank tariff of €4.90 plus 0.25% on a €1,000 order, again charged on both sides. Spreads, taxes, and slippage are additional, so every cost figure here understates the real drag.
- Holding periods are measured over overlapping windows of the index series, with every session treated as a possible entry. Anything shorter than one session is invisible to us because the database contains daily closing prices.
- The hit rate a trader would need is p* = (average loss + cost) ÷ (average gain + average loss), using the market’s own average gain and loss at that holding period.
- Leverage is modeled with a close-out at 50% of the deposit, in line with the retail rules used by the CFD brokers in our comparison. It uses CFD costs rather than share-dealing fees. The comparison quotes spreads from 0.6 points on an index around 24,000, or roughly 0.005% per round trip. The model uses four times that amount as a buffer for slippage.
Every figure comes from our own price database and is produced by a script in the repository. Running it again with the same cutoff date returns the same numbers. Not investment advice.