Savings Goal Calculator
The calculator works backward from a goal: how much has to go in every month to reach a target amount after a set number of years? The inputs are the target, any starting capital, the time frame and the expected return.
How the Calculation Works
It first grows the starting capital over the whole period. Whatever is still missing has to come from monthly contributions. The monthly amount is the payment that closes exactly that gap when each deposit earns one twelfth of the annual return per month. This is the savings plan calculation run in reverse.
The result rows show the monthly amount, the total paid in including starting capital, and the part that comes from growth. If the starting capital is enough on its own, the calculator shows a monthly amount of €0.
Worked Examples
Target €100,000:
| Starting capital | Period | Return | Per month | Paid in | Of which growth |
|---|---|---|---|---|---|
| €0 | 10 years | 6% | €610.21 | €73,225 | €26,775 |
| €0 | 15 years | 6% | €343.86 | €61,894 | €38,106 |
| €0 | 20 years | 6% | €216.43 | €51,943 | €48,057 |
| €0 | 15 years | 3% | €440.58 | €79,305 | €20,695 |
| €0 | 15 years | 0% | €555.56 | €100,000 | €0 |
| €20,000 | 15 years | 6% | €175.09 | €51,515 | €48,485 |
Ten more years, from 10 to 20, cut the required monthly amount by almost two thirds. At a 0% return, the math is simple division: €100,000 spread over 180 months.
How Reliable the Result Is
- The return is an assumption. At 6%, the goal looks closer than at 3%. A more cautious return gives a higher monthly amount and builds in a buffer.
- Prices move. The calculator grows the balance by the same rate every month. When the goal has a fixed date, such as a planned purchase, a market drop shortly before it can leave the target short. The Monte Carlo simulation shows the spread of possible outcomes.
- Taxes, costs and inflation are not deducted. At 2% inflation, €100,000 in 15 years buys about as much as €74,000 today. The inflation calculator runs that math.
The opposite question, what a fixed monthly amount grows into, is covered by the ETF savings plan calculator . The article on savings plans vs lump sums explains why the two paths play out differently.
More calculators and tools are listed in the tools overview.
Latest Investment Analysis
 · Mixed
Weekly Analysis: MSCI China Leads the Week (+2.6%) · October 5–9, 2026
 · Mixed
Weekly Analysis: Nikkei 225 Sets the Tone for the Week (+3.4%) · September 28 – October 2, 2026
 · Risk-on
Weekly Analysis: S&P 500 Information Technology Leads the Week (+3.5%) · September 21–25, 2026
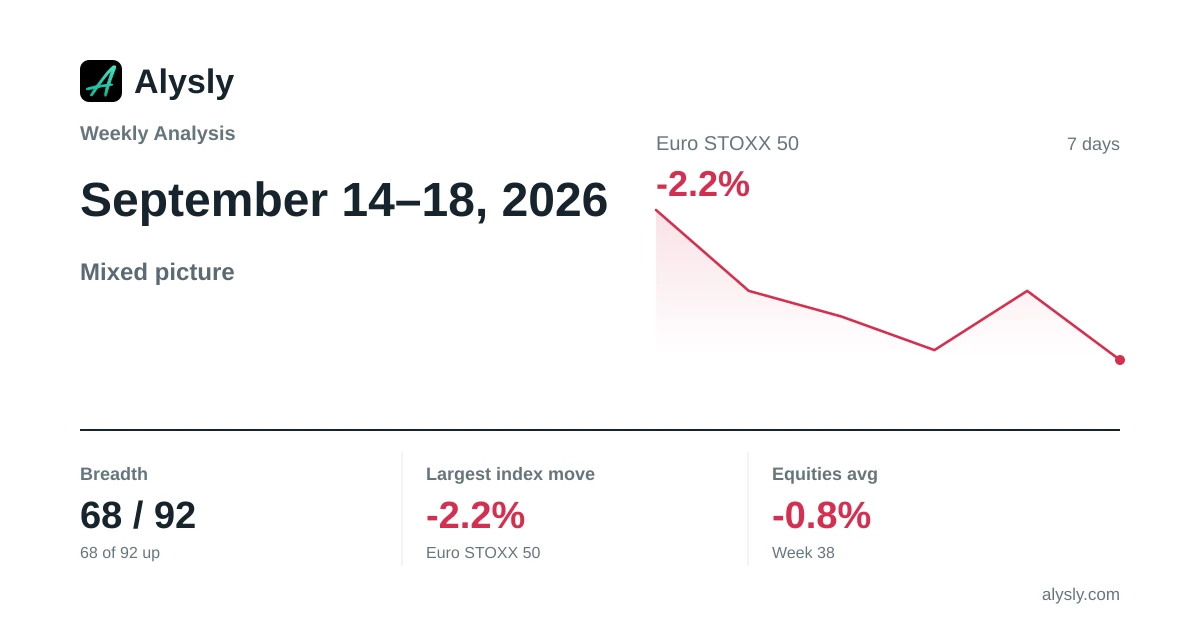 · Mixed
Weekly Analysis: Euro STOXX 50 Weighs on the Week (-2.2%) · September 14–18, 2026
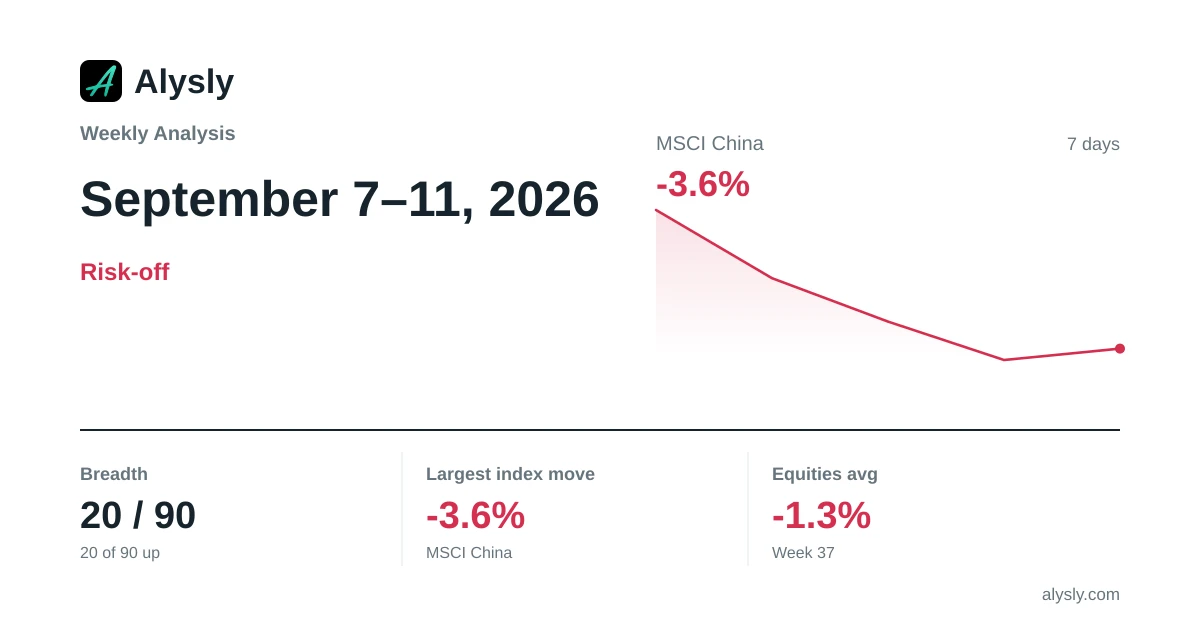 · Risk-off
Weekly Analysis: MSCI China Lags the Week (-3.6%) · September 7–11, 2026