Dividend Portfolio Calculator
The calculator answers one question: how much capital does a portfolio of distributing ETFs need to produce a given annual payout at a given distribution yield? The inputs are the desired payout and the yield.
How the Calculation Works
The required capital is the desired payout divided by the distribution yield. €12,000 a year at a 3% yield takes €400,000.
For the net figures, the calculator applies German tax rules for equity ETFs: a 26.375% flat tax including the solidarity surcharge, charged on 70% of each distribution. The other 30% is tax-free under the partial exemption for equity funds. That works out to an effective rate of about 18.5%. The row “Portfolio for net payout” shows how large the capital must be for the target amount to arrive after that tax.
Worked Examples
| Target per year | Distribution yield | Capital, gross | Capital for the amount net |
|---|---|---|---|
| €6,000 | 3% | €200,000 | €245,286 |
| €12,000 | 2% | €600,000 | €735,858 |
| €12,000 | 3% | €400,000 | €490,572 |
| €12,000 | 4% | €300,000 | €367,929 |
| €24,000 | 3% | €800,000 | €981,144 |
The yield has a strong effect on the result. One percentage point less, 2 instead of 3%, raises the required capital by half. Of a €12,000 gross payout, €9,784 is left after tax.
What the Calculation Rests On
- The distribution yield is a snapshot. It relates the last twelve months of payouts to today’s price. When the price falls, the yield rises on paper without a single extra euro being paid. Companies also cut dividends in downturns.
- Price changes are left out. The calculator only looks at payouts. Whether the capital itself grows or shrinks is not modeled, and a high yield says nothing about total return.
- Allowance, church tax and the lower-rate test are not included. Germany’s saver’s allowance of €1,000 (€2,000 for joint filers) lowers the actual tax; church tax raises it.
- Equity ETFs only. Bond and multi-asset funds have different partial exemptions. The article on ETF taxes in Germany has the details.
The article on dividend ETFs explains how these funds are built and why they often lean on a few sectors. The withdrawal plan calculator shows how long a portfolio lasts when it pays out through regular sales instead of distributions.
More calculators and tools are listed in the tools overview.
Latest Investment Analysis
 · Mixed
Weekly Analysis: MSCI China Leads the Week (+2.6%) · October 5–9, 2026
 · Mixed
Weekly Analysis: Nikkei 225 Sets the Tone for the Week (+3.4%) · September 28 – October 2, 2026
 · Risk-on
Weekly Analysis: S&P 500 Information Technology Leads the Week (+3.5%) · September 21–25, 2026
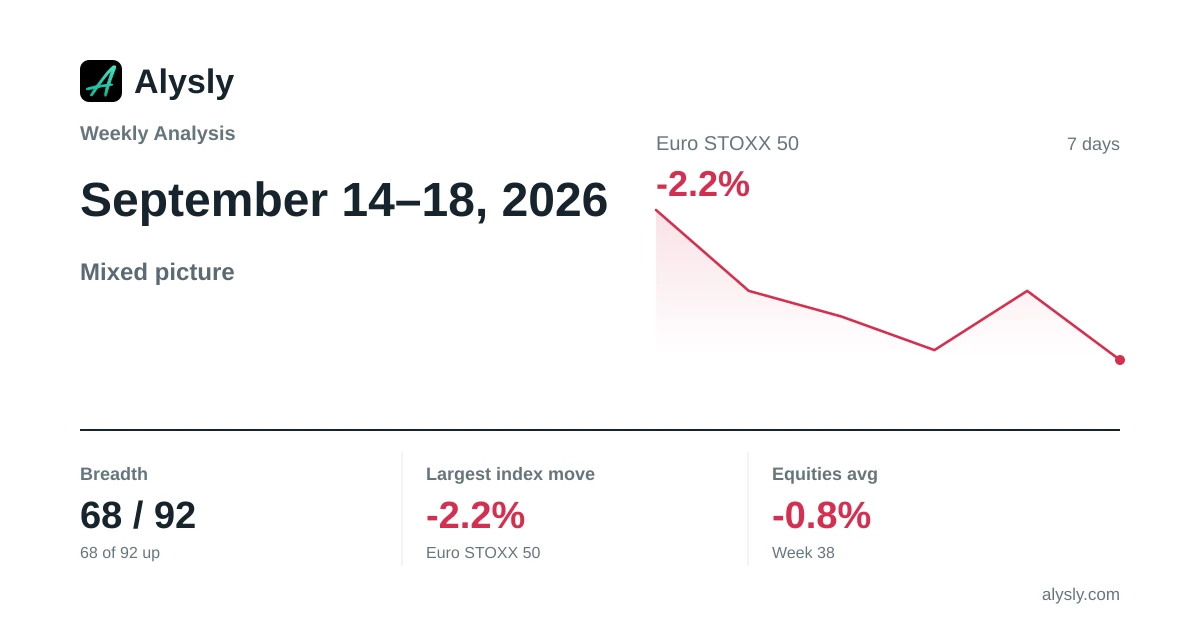 · Mixed
Weekly Analysis: Euro STOXX 50 Weighs on the Week (-2.2%) · September 14–18, 2026
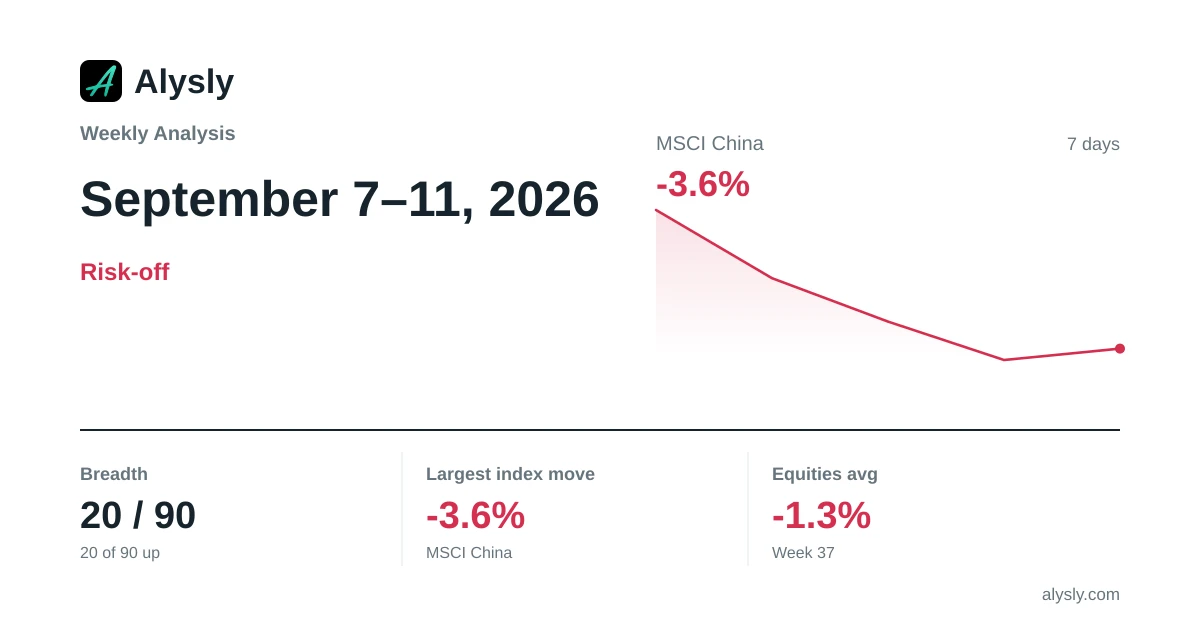 · Risk-off
Weekly Analysis: MSCI China Lags the Week (-3.6%) · September 7–11, 2026