Single Stocks vs ETF
The calculator compares the cost of two routes to the same portfolio value: a selection of single stocks that is rebalanced regularly, and one ETF with an ongoing expense ratio. Returns and risk are not part of the comparison.
How the Calculation Works
Single stocks: number of stocks × order fee per trade × rebalances per year. The calculator assumes that each rebalance trades every position once. 20 stocks, a €5 fee and two rebalances come to €200 a year.
ETF: portfolio value × TER. The expense ratio is deducted inside the fund and lowers its return; nobody receives a bill for it. €50,000 at a 0.2% TER is €100 a year.
The last row multiplies the annual difference by the number of years. The portfolio value stays constant, so growth is not included.
Worked Examples
20 years in each case, ETF with a 0.2% TER:
| Portfolio | Stocks | Fee | Rebalances | Single stocks / year | ETF / year | Difference over 20 years |
|---|---|---|---|---|---|---|
| €50,000 | 20 | €5 | 2 | €200 | €100 | €2,000 |
| €50,000 | 20 | €1 | 1 | €20 | €100 | €1,600 |
| €50,000 | 30 | €5 | 4 | €600 | €100 | €10,000 |
| €200,000 | 20 | €5 | 2 | €200 | €400 | €4,000 |
The direction flips with portfolio size. Order fees are fixed amounts per trade, while the TER grows with the assets. With small portfolios and frequent trading, single stocks cost more; with large portfolios and rare trades, it can be the other way around. The ETF concentration analysis shows how much of an index already sits in a handful of companies.
What a Pure Cost Comparison Does Not Show
- Diversification. 20 stocks are far less spread out than a world ETF holding more than 1,000 companies. When one company fails, a small portfolio feels it more.
- Trading costs beyond the fee. Bid-ask spreads apply to stocks and ETFs, and they tend to be wider for smaller companies. Taxes on gains realized when rebalancing come on top.
- Time. Picking, monitoring and rebalancing single stocks takes time that no row accounts for.
- Other fund costs. Besides the TER, an ETF has transaction costs from tracking its index. The article on ETF fees covers the full picture.
The ETF portfolio analysis shows which companies appear more than once across an existing mix of ETFs.
More calculators and tools are listed in the tools overview.
Latest Investment Analysis
 · Mixed
Weekly Analysis: MSCI China Leads the Week (+2.6%) · October 5–9, 2026
 · Mixed
Weekly Analysis: Nikkei 225 Sets the Tone for the Week (+3.4%) · September 28 – October 2, 2026
 · Risk-on
Weekly Analysis: S&P 500 Information Technology Leads the Week (+3.5%) · September 21–25, 2026
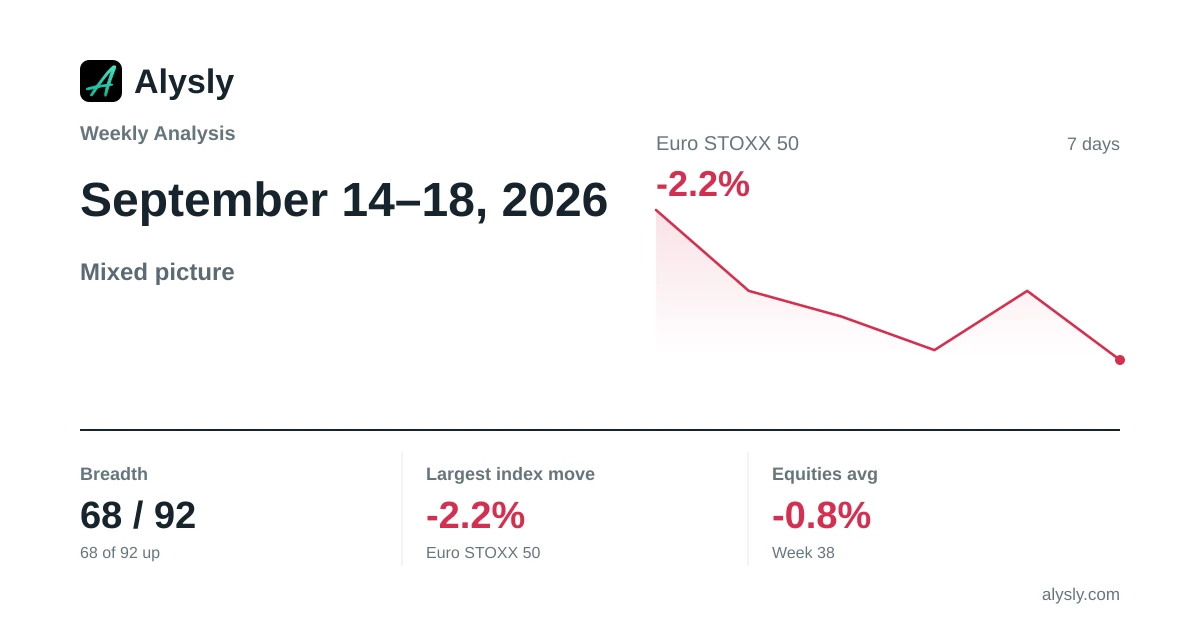 · Mixed
Weekly Analysis: Euro STOXX 50 Weighs on the Week (-2.2%) · September 14–18, 2026
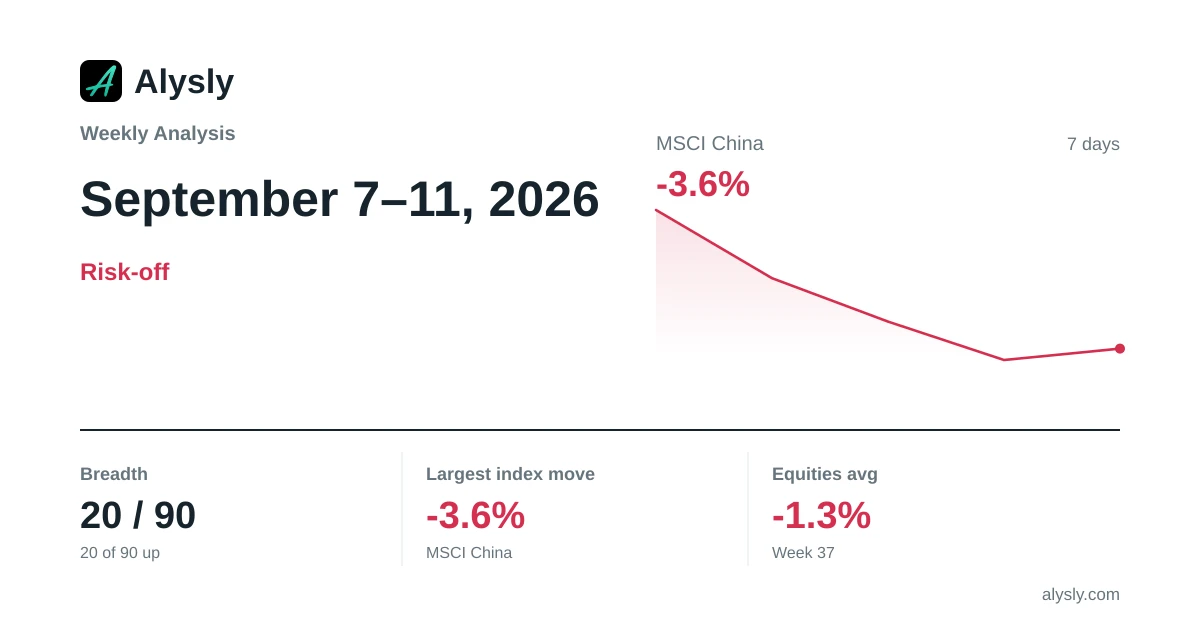 · Risk-off
Weekly Analysis: MSCI China Lags the Week (-3.6%) · September 7–11, 2026