Real Estate vs ETF Portfolio
The calculator puts two ways of investing the same money side by side over several years: a rented residential property and an ETF portfolio. Both get the same starting capital and the same monthly contribution.
How the Calculation Works
Both sides use the same formula: the starting capital and the monthly contribution grow at a fixed annual return, compounded monthly. Only the return differs.
- ETF: the ETF return entered.
- Property: appreciation plus net rental yield. Net rental yield is the annual rent after costs that cannot be passed on to tenants, relative to the purchase price.
Appreciation is pre-filled with an actual track record rather than a round number. The options are official residential property price indices: Eurostat for EU countries and the Case-Shiller index for the United States. The default is Germany at about 2.9% a year over 21 years (series as of March 31, 2026). The range runs from 0.1% in Italy to 5.6% in Portugal. The overview of property prices shows each series in detail.
Worked Example
€50,000 starting capital, €500 a month, 20 years, a 6.5% ETF return and a 3.0% net rental yield. Both sides pay in €170,000.
| Property appreciation | ETF portfolio | Property | Difference |
|---|---|---|---|
| 2.9% (Germany) | €428,033 | €390,552 | €37,481 for the ETF |
| 0.1% (Italy) | €428,033 | €258,829 | €169,204 for the ETF |
| 5.6% (Portugal) | €428,033 | €594,987 | €166,954 for the property |
| 2.9%, rental yield only 2.0% | €428,033 | €336,118 | €91,915 for the ETF |
The result depends almost entirely on two assumptions: appreciation at the location and the rental yield after costs. One percentage point less rental yield moves the gap by more than €50,000 after 20 years.
What the Comparison Leaves Out on Purpose
- Mortgage and leverage. Most properties are financed. A loan magnifies gains and losses on the equity put in. The calculator compares without leverage. The mortgage rate calculator and the purchase cost calculator show how financing adds up.
- Purchase costs, upkeep and vacancy. In Germany, transfer tax, notary and agent fees come to between 5 and more than 10% of the price, depending on the state. They belong in the net rental yield or reduce the starting capital.
- Taxes. Rental income, depreciation, Germany’s ten-year holding rule for tax-free property sales and the flat tax on ETF income all follow different rules.
- A single property is not an index. The indices measure a national average. Location and condition shape the value of one apartment more than the national figure does.
- Volatility. Both returns apply evenly every year. ETF prices visibly fluctuate, while property prices are measured less often and therefore look calmer.
More calculators and tools are listed in the tools overview.
Latest Investment Analysis
 · Mixed
Weekly Analysis: MSCI China Leads the Week (+2.6%) · October 5–9, 2026
 · Mixed
Weekly Analysis: Nikkei 225 Sets the Tone for the Week (+3.4%) · September 28 – October 2, 2026
 · Risk-on
Weekly Analysis: S&P 500 Information Technology Leads the Week (+3.5%) · September 21–25, 2026
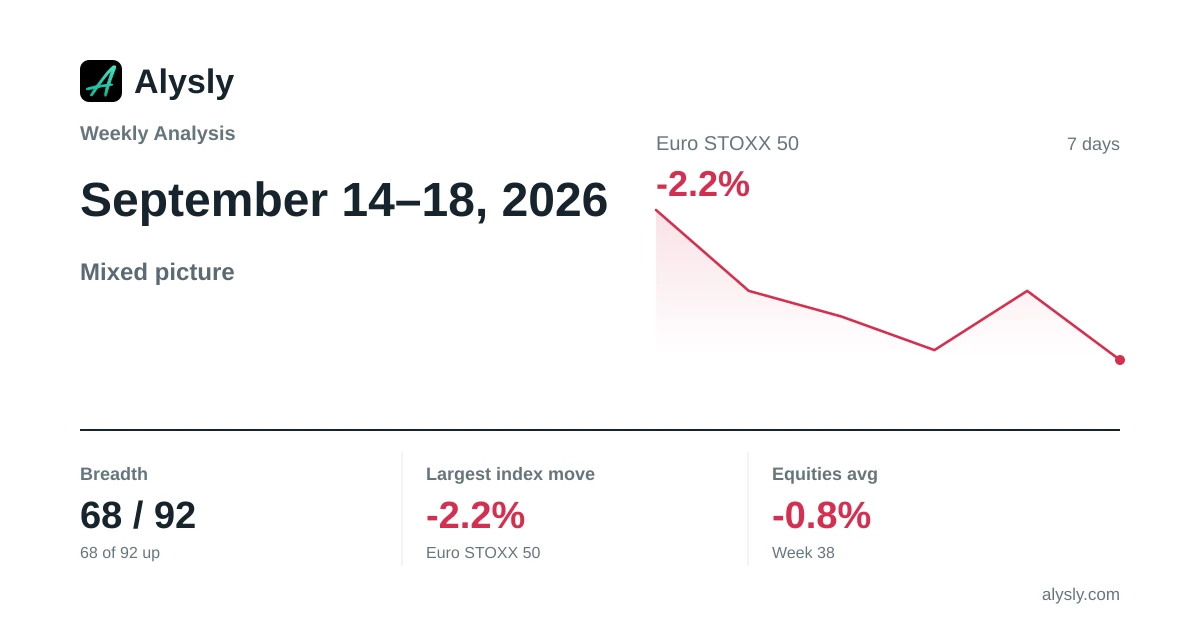 · Mixed
Weekly Analysis: Euro STOXX 50 Weighs on the Week (-2.2%) · September 14–18, 2026
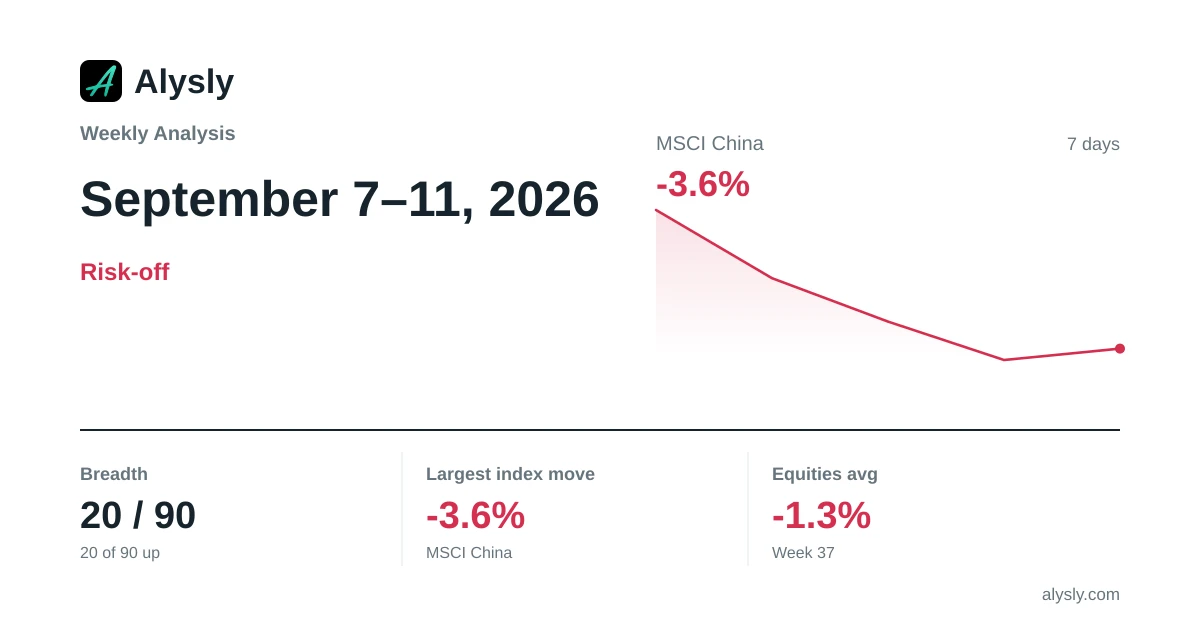 · Risk-off
Weekly Analysis: MSCI China Lags the Week (-3.6%) · September 7–11, 2026