Circle Internet Group Inc. Class A (CRCL)
CRCL · Information Technology ·  United States
Circle Internet Group Inc. Class A (CRCL) is a company in the Information Technology sector, based in United States. The stock is held in 15 ETFs we track – with its largest weight of 0.06 % in XUIT (msci-usa-it). Anyone holding one of these ETFs also owns a small indirect stake in Circle Internet Group.
Above-average ETF coverage: 15 of the 95 ETFs we cover hold Circle Internet Group, spread across 7 indices. That puts the stock in more ETFs than 74.8 % of the 4,334 stocks we cover.
Price chart
Performance
| Year to date | +1.5 % | 1 year | -40.3 % |
|---|---|---|---|
| 1 month | +7.9 % | 3 months | -0.2 % |
Measured in euros, Circle Internet Group returned +3.3 % year to date and -38.9 % over one year. The gap to the dollar figures above comes from the exchange rate alone: each daily price is converted at the ECB euro reference rate for the same day.
Risk metrics
The close on Sep 16, 2026 was 69.5 % below the highest close since Jun 5, 2025, reached on Jun 23, 2025. Over the last 252 trading days, on days when the S&P 500 rose or fell 1 %, Circle Internet Group moved on average 3.02 % in the same direction. The correlation of 0.40 shows how reliable that average is: the broad market explained part of the daily moves, but far from all.
Correlated with
The strongest co-movers on top, the most inverse below. Low or negative values improve portfolio diversification.
| Instrument | r | −1 … +1 |
|---|---|---|
| Coinbase Global Inc. Class A | +0.80 | |
| Strategy Inc. Class A | +0.72 | |
| Bitcoin | +0.65 | |
| WBTC | +0.65 | |
| Robinhood Markets Inc. Class A | +0.63 | |
| 1INCH | +0.62 | |
| USD/CHF | -0.45 | |
| Waste Management Inc. | -0.29 | |
| USD/JPY | -0.28 |
Key financials
Latest reported fiscal year (FY2025, period end 2025-12-31) as filed with the SEC.
| Fiscal year | Revenue | Net income | Margin |
|---|---|---|---|
| FY2023 | 0.0 | 0.3 | 1347.2 % |
| FY2024 | 0.0 | 0.2 | 1026.2 % |
| FY2025 | 0.1 | -0.1 | -63.3 % |
Held in these ETFs
| ETF | Index | Weight | per €1,000 in the ETF |
|---|---|---|---|
| XUIT / XUTC | msci-usa-it | 0.06 % | €0.60 |
| XDWT | msci-world-it | 0.05 % | €0.50 |
| WIMI | msci-world-imi | 0.02 % | €0.20 |
| XD9U / XD9D | msci-usa | 0.02 % | €0.20 |
| SWWD | msci-world | 0.01 % | €0.10 |
| SPYI / SPSA | msci-acwi-imi | 0.01 % | €0.10 |
| SPYY | msci-acwi | 0.01 % | €0.10 |
| EUNL | msci-world | 0.01 % | €0.10 |
| IUSQ | msci-acwi | 0.01 % | €0.10 |
| SPPW | msci-world | 0.01 % | €0.10 |
| XDWD / XDWL | msci-world | 0.01 % | €0.10 |
The last column turns the weight into euros: this much of €1,000 invested in one of these funds is allocated to Circle Internet Group as of the fund's latest holdings list.
How much Circle Internet Group Inc. Class A overlaps with other holdings in a portfolio is shown by the Portfolio X-Ray and the ETF overlap check.
Stocks with similar ETF exposure
Names that reach a portfolio through largely the same funds as Circle Internet Group — the figure counts the ETFs holding both.
- Entegris Inc.ENTG · 15 shared ETFs
- Samsara Inc. Class AIOT · 15 shared ETFs
 MongoDB Inc. Class AMDB · 15 shared ETFs
 Everpure Inc. Class AP · 15 shared ETFs
- Atlassian Corp. Class ATEAM · 15 shared ETFs
 FabrinetFN · 15 shared ETFs
 Snowflake Inc.SNOW · 15 shared ETFs
- Credo Technology Group Holding Ltd.CRDO · 15 shared ETFs
Key figures side by side
| Stock | 1 year | Volatility p.a. | Net margin | Revenue growth |
|---|---|---|---|---|
| Circle Internet Group | -40.3 % | 111.4 % | -63.3 % | +624.0 % |
| Entegris | +40.6 % | 62.2 % | 7.4 % | -1.4 % |
| Samsara | +3.0 % | 56.1 % | -0.6 % | +29.6 % |
| MongoDB | +15.0 % | 69.1 % | -2.9 % | +22.8 % |
| Everpure | – | – | 5.1 % | +15.6 % |
| Atlassian | +10.6 % | 65.8 % | -4.9 % | +19.7 % |
| Fabrinet | +10.4 % | 68.8 % | 10.2 % | +35.7 % |
| Snowflake | +53.3 % | 61.4 % | -28.4 % | +29.2 % |
| Credo Technology Group Holding | -1.8 % | 96.7 % | 35.4 % | +205.7 % |
Return and volatility from our daily closing prices in US dollars; margin and growth from the latest SEC annual filing. Fiscal years do not all end on the same date.
Latest Investment Intelligence News: Stocks
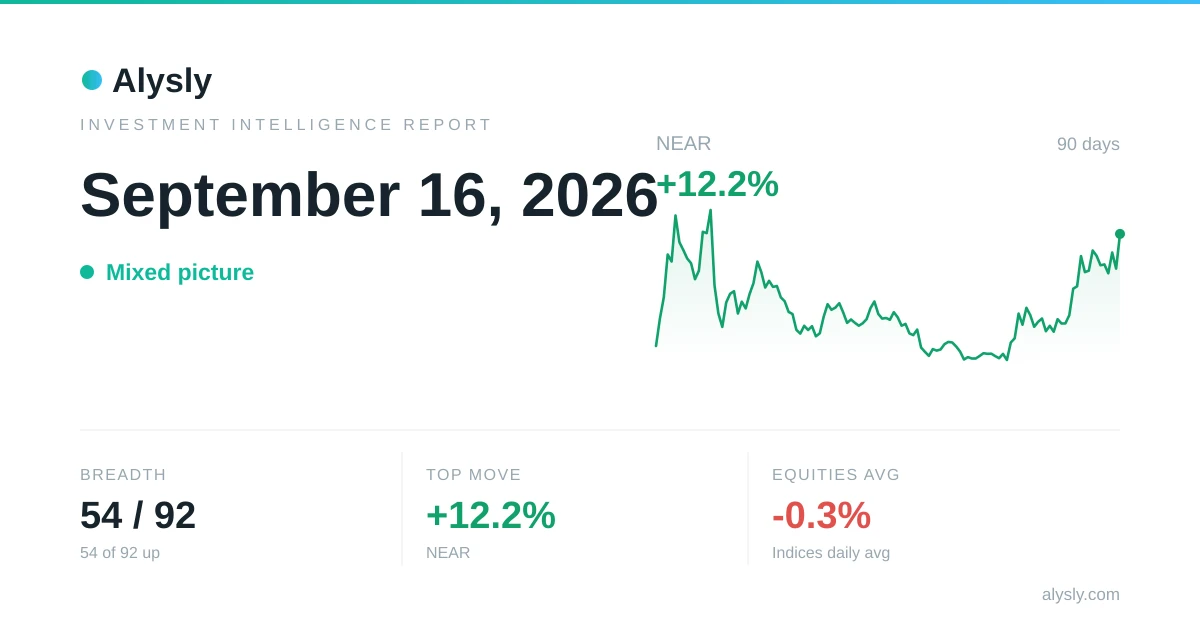 · Mixed
NEAR surges 12.2% – September 16, 2026
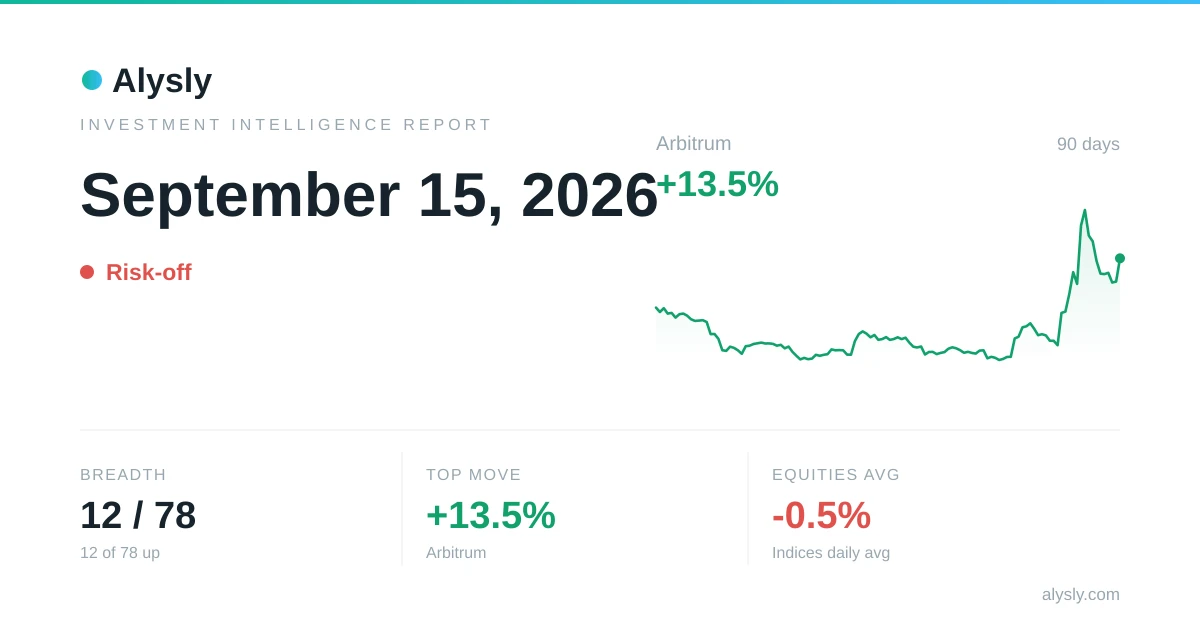 · Risk-off
Red across the board: only 12 of 78 assets hold gains – September 15, 2026
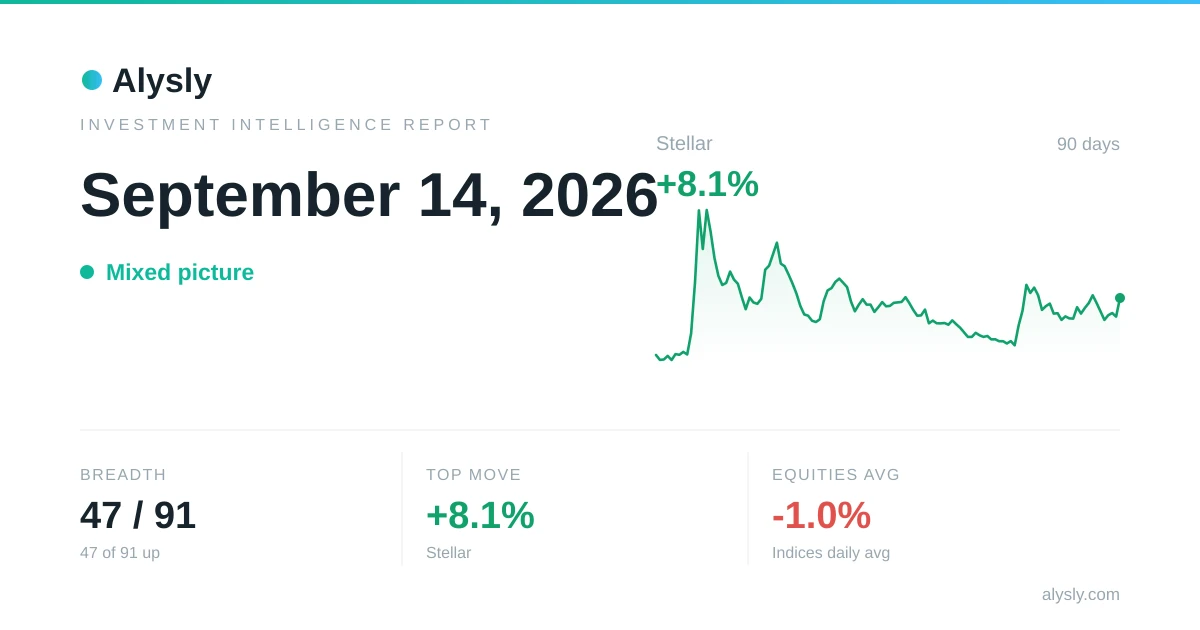 · Mixed
Crypto tops stocks: Bitcoin at +1.8% versus the S&P 500's -0.5% – September 14, 2026
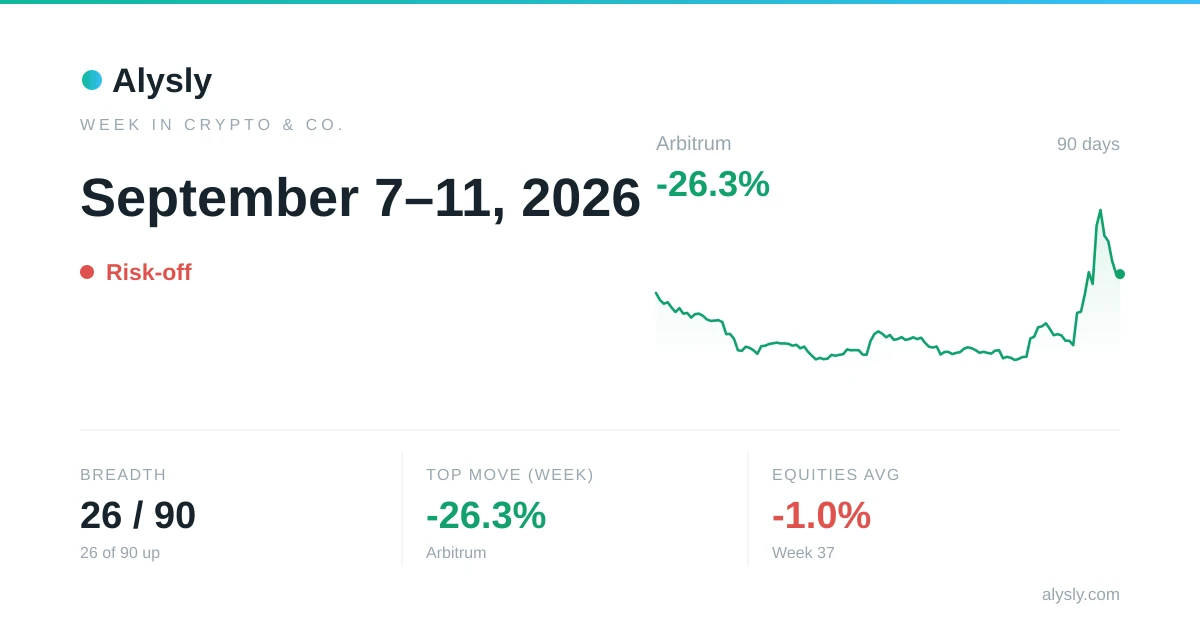 · Risk-off
Crypto, commodities & FX this week: Arbitrum -26.3% · September 7–11, 2026
 · Risk-off
The week in markets: MSCI China lags the week (-2.6%) · September 7–11, 2026