 T Price
T · T/USD · rank #36
T (T) trades against the US dollar – ranked #36 by market capitalization among the crypto assets we track. Year to date T is at -47.9 %, over three months at +18.6 % and over twelve months at -73.3 %. The current price sits near its 52-week low. Crypto assets are far more volatile than stocks or ETFs – double-digit daily moves are common and a total loss is possible. The price history of T and its key performance metrics, based on daily closing prices, follow below. Prices and performance for every tracked coin are listed in the cryptocurrency price overview.
Measured in euros, T returned -46.9 % year to date and -72.7 % over one year. The gap to the dollar figures above comes from the exchange rate alone: each daily price is converted at the ECB euro reference rate for the same day.
Risk metrics
Correlated with
The strongest co-movers on top, the most inverse below. Low or negative values improve portfolio diversification.
| Instrument | r | −1 … +1 |
|---|---|---|
| Toncoin | +0.59 | |
| EGLD | +0.58 | |
| SXT | +0.58 | |
| HOT | +0.45 | |
| XVG | +0.40 | |
| D | +0.38 | |
| Credo Technology Group Holding Ltd. | -0.32 | |
| TransDigm Group Incorporated | -0.21 | |
| United Therapeutics Corporation | -0.21 |
Altcoin Season Index
This coin is not among the evaluated top altcoins. Open the Altcoin Season Index (as of 2026-09-16).
Latest Investment Intelligence News: Crypto
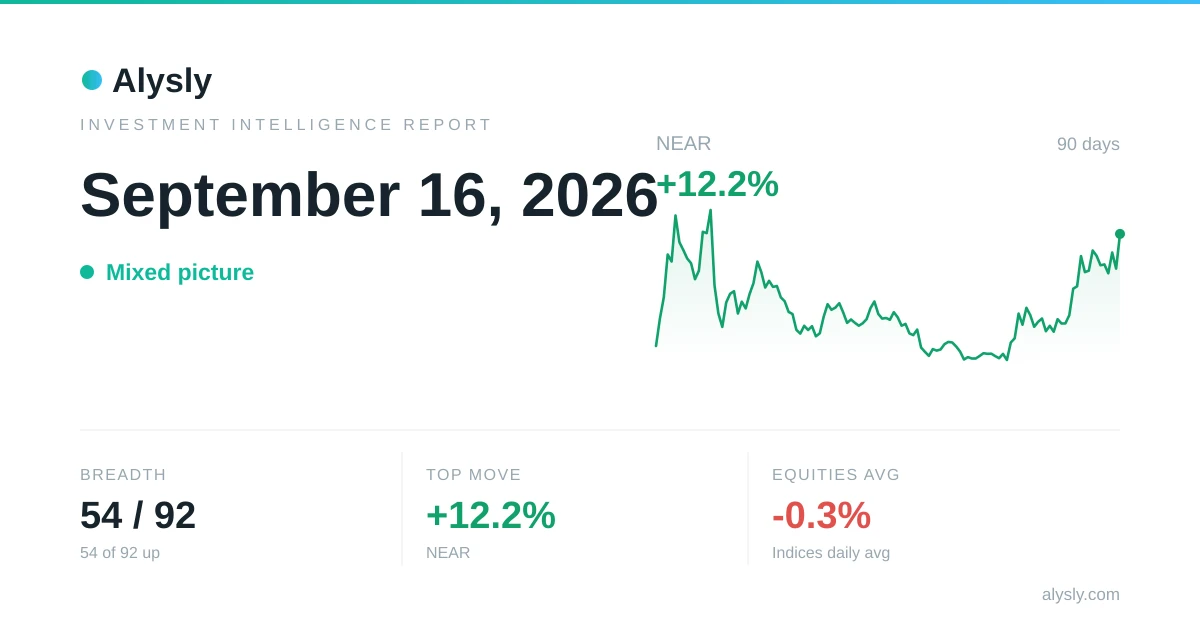 · Mixed
NEAR surges 12.2% – September 16, 2026
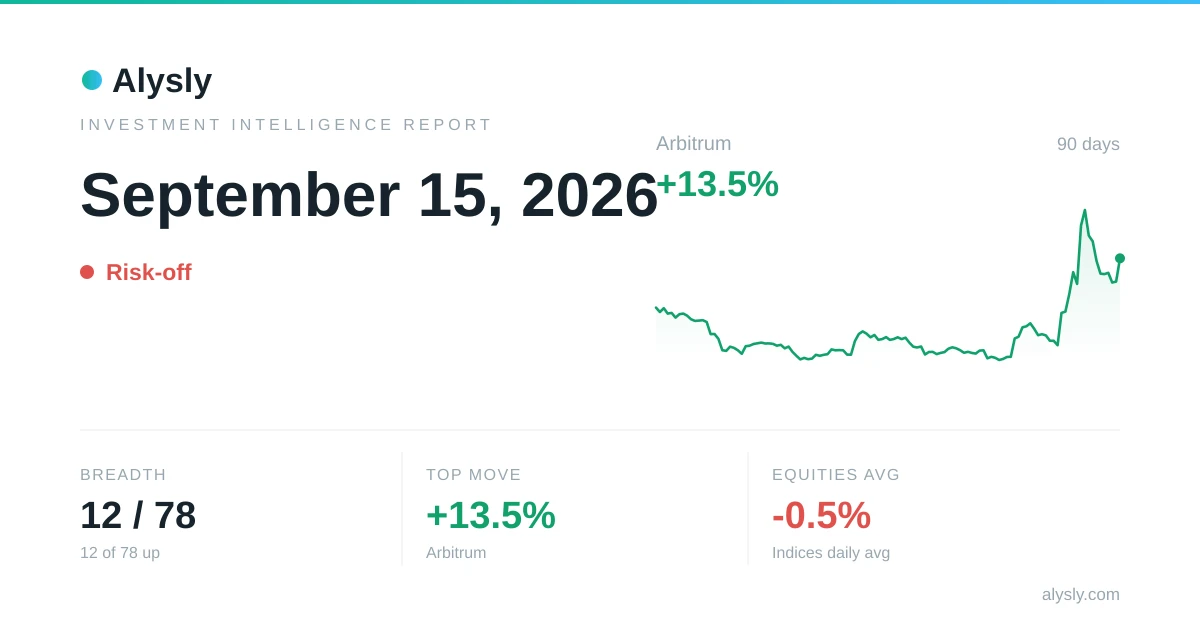 · Risk-off
Red across the board: only 12 of 78 assets hold gains – September 15, 2026
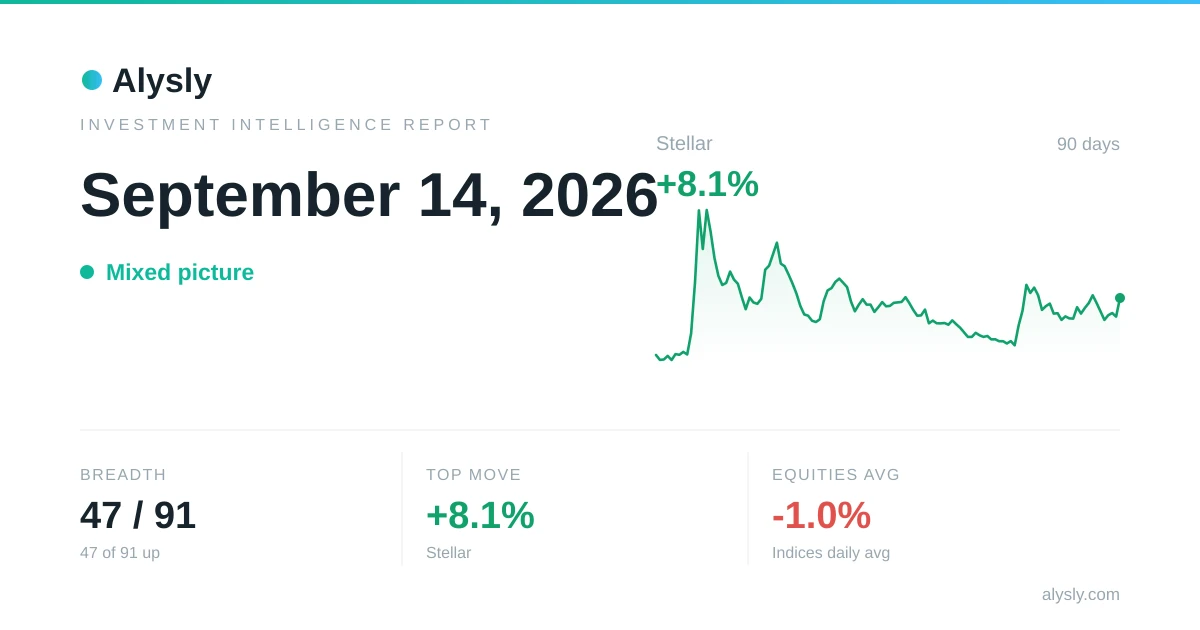 · Mixed
Crypto tops stocks: Bitcoin at +1.8% versus the S&P 500's -0.5% – September 14, 2026
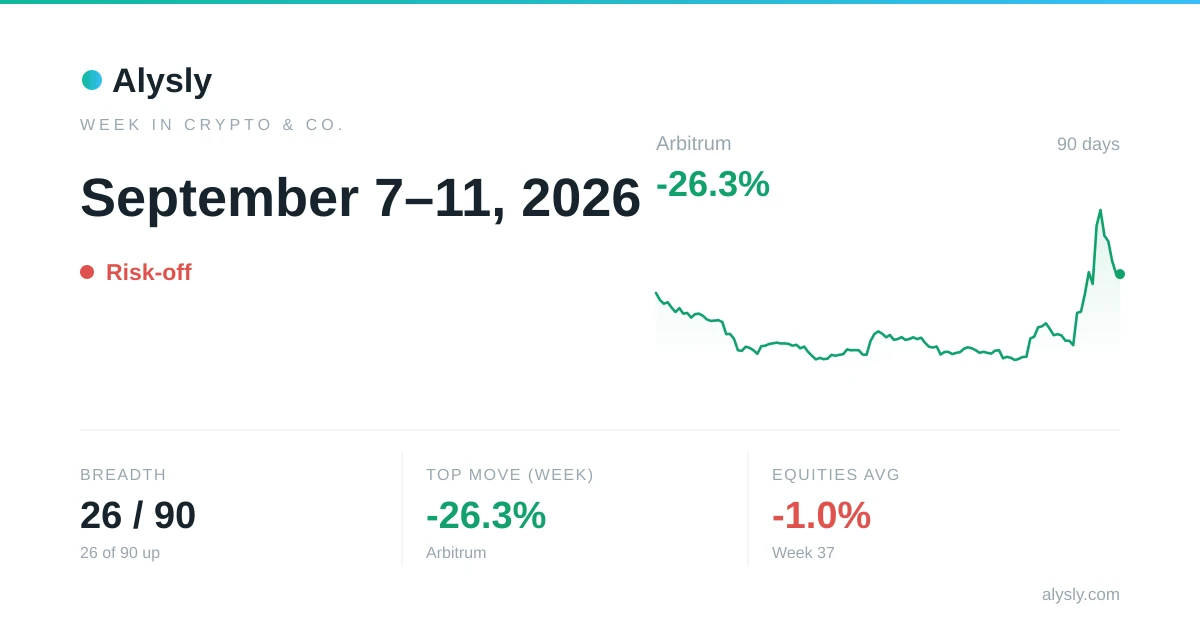 · Risk-off
Crypto, commodities & FX this week: Arbitrum -26.3% · September 7–11, 2026
 · Risk-off
The week in markets: MSCI China lags the week (-2.6%) · September 7–11, 2026