Red across the board: only 20 of 90 assets hold gains – August 28, 2026
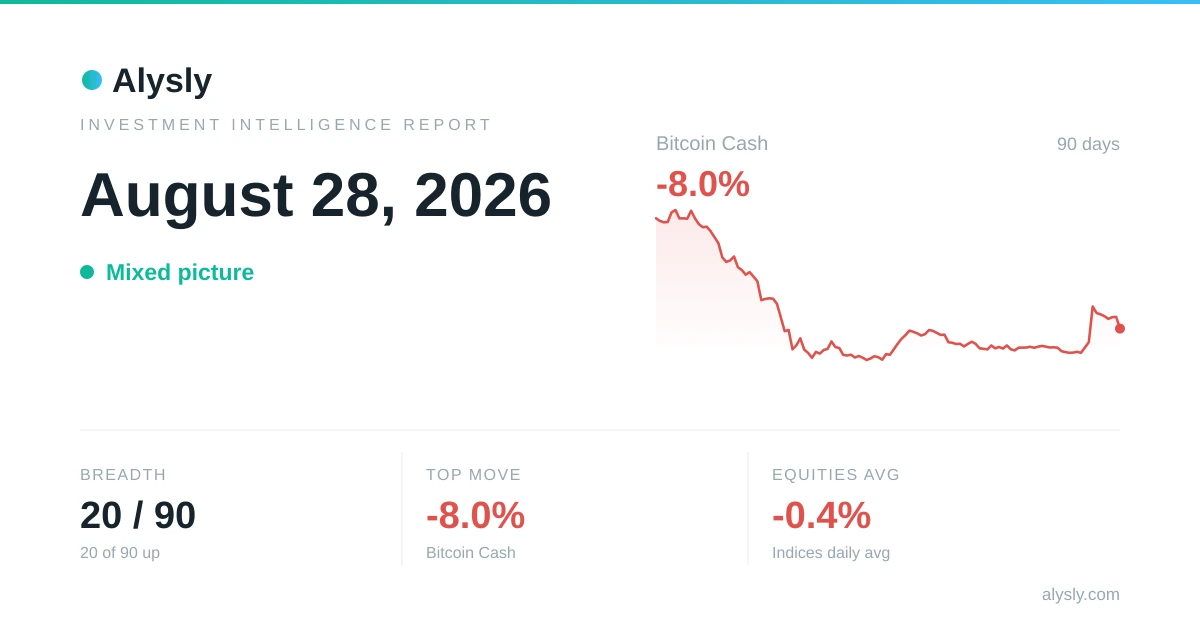
After the US close on August 28, 2026, the markets tracked by Alysly showed a mixed picture: 20 of 90 monitored assets (22 %) closed higher. The most pronounced move came from the crypto asset Bitcoin Cash at -8.0 %. The major equity indices moved -0.4 % on average, while digital assets came in at -2.8 %.
The key points at a glance
- Breadth: 20 of 90 assets higher (22 %) – a mixed picture.
- Biggest daily move: Bitcoin Cash at -8.0 %.
- Indices: 4 of 16 higher – strongest MSCI China (+0.60 %), weakest S&P 500 Informationstechnologie (-1.55 %).
- Asset classes: leading equities (-0.4 %), lagging crypto (-2.8 %).
- Crypto: top gainer DEXE (+28.8 %), top loser TUT (-20.5 %).
- Correlation: EUR/USD ↔ Gold at +0.60 (strongly positively correlated).
- Real assets: top hammer price Porsche 911 Turbo (930) — 1975–1989 at $258,000 (Classic cars).
Market barometer
Breadth = share of all tracked instruments (indices, liquid crypto, commodities, forex) with a positive daily change. Bars scale with the magnitude of each asset class's average daily return.
In focus: Bitcoin Cash
At -8.0 %, Bitcoin Cash was the day's most notable single move. The chart shows its trajectory over the selected range:
Indices on the day


Of the 16 benchmark indices tracked, 4 closed higher – so the majority slipped. MSCI China led the field at +0.60 %, while S&P 500 Informationstechnologie trailed at -1.55 %. The “52W” column shows where each index sits within its yearly range – a marker far to the right means it is trading close to its 52-week high.
Crypto: daily gainers & losers
From the 50 largest crypto assets by trading volume – illiquid micro-caps excluded.
Gainers
 DEXE
DEXE EDEN
EDEN HEMI
HEMI TRUMP
TRUMP CHIP
CHIP ENSO
ENSO TUT
TUT MOVR
MOVR BMT
BMT BEAMX
BEAMX FET
FET Bitcoin Cash
-2.8 %. DEXE at +28.8 %, with TUT trailing at -20.5 %. Crypto remains the most volatile asset class covered here – daily swings of this magnitude are normal and say little about the long-term trend.
Commodities & precious metals
Precious metals averaged -0.9 %, energy and industrial commodities -2.1 %. Both groups declined. Gold is a traditional hedge, while crude oil and copper act as growth barometers.
| Name | Price | Change |
|---|---|---|
| Gold | 4694.5 | -0.07 % |
| Silver | 68.682 | +0.13 % |
| Platinum | 1861.5 | -1.47 % |
| Palladium | 1333.2 | -2.21 % |
| WTI crude | 85.01 | -2.35 % |
| Brent crude | 90.54 | -2.30 % |
| Gasoline | 2.9688 | -2.56 % |
| Heating oil | 4.1734 | -4.82 % |
| Copper | 6.714 | +1.65 % |
Foreign exchange (Forex)
The key pair EUR/USD moved -0.16 % – the US dollar firmed against the euro, showing relative strength. A firmer dollar tends to weigh on commodities and emerging markets, a weaker one supports them. Prices are drawn from CME FX futures.
| Pair | Price | Change |
|---|---|---|
  EUR/USD EUR/USD | 1.16745 | -0.16 % |
 GBP/USD GBP/USD | 1.3631 | -0.15 % |
 USD/JPY USD/JPY | 158.9319771137953 | +0.11 % |
 AUD/USD AUD/USD | 0.71455 | -0.42 % |
 USD/CAD USD/CAD | 1.3837000138370001 | +0.65 % |
 USD/CHF USD/CHF | 0.8007366777435241 | +0.22 % |
Real assets: new hammer prices
In the window since 21 August 2026, 1 new hammer prices are on file. An auction price is not a quote: it is struck once, between two bidders, and applies to one specific item.
| Asset class | Records | Median | Highest hammer price | Price |
|---|---|---|---|---|
| Classic cars | 1 | $258,000 | Porsche 911 Turbo (930) — 1975–1989 26 Aug 2026 | $258,000 |
Median = the middle hammer price among this window's records, not the value of a fixed position. It moves simply because different items come up for sale each week — precisely the composition effect the price index below avoids. Prices are hammer prices including the buyer's premium.
No lot changed hands in trading cards in this window – the most recent recorded sale is 11 days back (17 August 2026). With few, high-priced items such gaps are the norm, not a data outage. No lot changed hands in watches in this window – the most recent recorded sale is 76 days back (13 June 2026). With few, high-priced items such gaps are the norm, not a data outage.
The trading-card price index stands at 536.8, +251.0 % against a year ago (base 100 at the first quarter covered, as of 17 August 2026). It measures price changes of the same good rather than the median of a changing offer. Against the previous reading (29 June 2026) that is -2.9 % – a quarterly figure, not a daily one.
Residential property: an official index, not a hammer price
For residential property there are no individual sales to report: prices there are formed in statistics, not under the hammer. The latest available reading is 1 June 2026 – 88 days before this report, which reflects the publication lag of the sources rather than missing data.
| Series | Level | Prior print | 1 year |
|---|---|---|---|
| United States (Case-Shiller) 1 Jun 2026 | 336.7 | +0.4 % | +1.7 % |
| Germany 31 Mar 2026 | 153.4 | +0.3 % | +1.4 % |
| Euro area 31 Mar 2026 | 157.4 | +0.9 % | +4.6 % |
Cross-asset correlations
Over the past 90 trading days, EUR/USD and Gold were strongly positively correlated, with a correlation coefficient of +0.60. A value near +1 means they move together, near −1 they move opposite, near 0 there is no linear link. For portfolio diversification, low or negative correlations are valuable – they smooth out volatility.
| Pair | r (90d) | −1 … +1 |
|---|---|---|
| S&P 500 ↔ Bitcoin | +0.34 | |
| S&P 500 ↔ Gold | +0.43 | |
| Gold ↔ Crude oil (WTI) | -0.28 | |
| EUR/USD ↔ Gold | +0.60 |
Summary
All told, August 28, 2026 was a day of a mixed picture across the markets Alysly tracks: 20 of 90 assets closed higher. The headline came from Bitcoin Cash at -8.0 %. Across asset classes, equities led (-0.4 %) while crypto lagged (-2.8 %). The correlation between EUR/USD and Gold was strongly positively correlated (+0.60) – a gauge of how much diversification benefit combining the two currently offers. Away from the capital markets, the top hammer price was Porsche 911 Turbo (930) — 1975–1989 at $258,000 – a price struck at a single table rather than on an exchange. For long-term investors, though, single trading days are noise: what matters is broad diversification across asset classes, regions and time – not any one day's move.
Latest Investment Intelligence News
 · Mixed
The week in markets: Russell 2000 lags the week (-1.4%) · August 24–28, 2026
 · Risk-on
S&P 500 Informationstechnologie tops the major indices at +3.2% – August 27, 2026
 · Mixed
POL tumbles 9.4% – August 26, 2026
 · Mixed
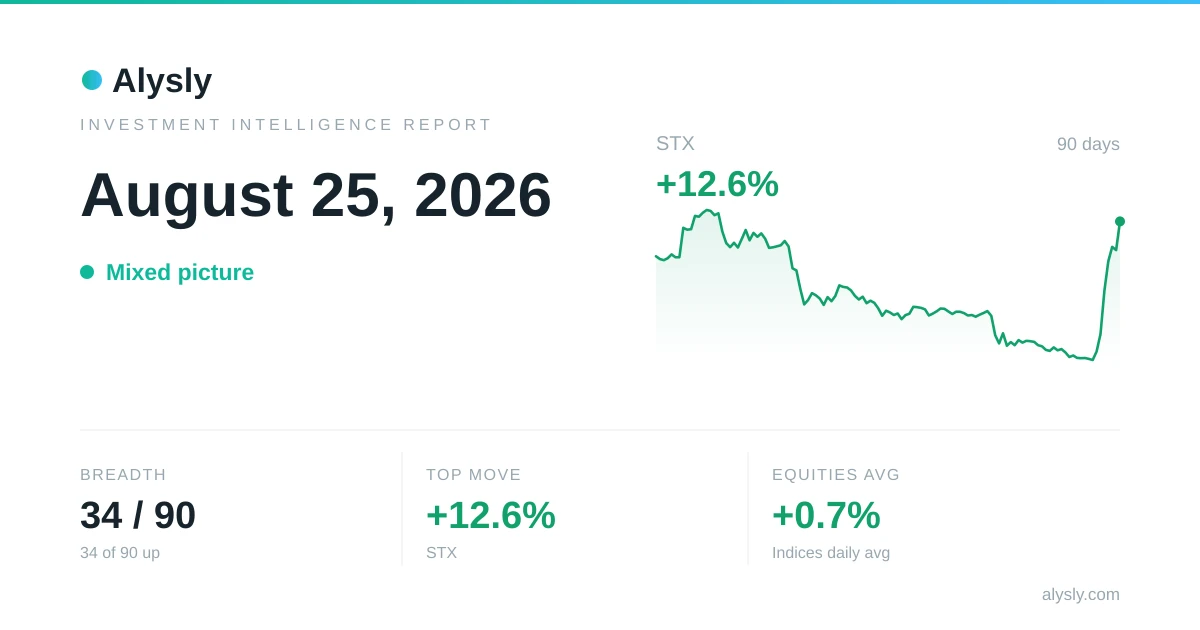
STX climbs 12.6% – August 25, 2026
 · Risk-off
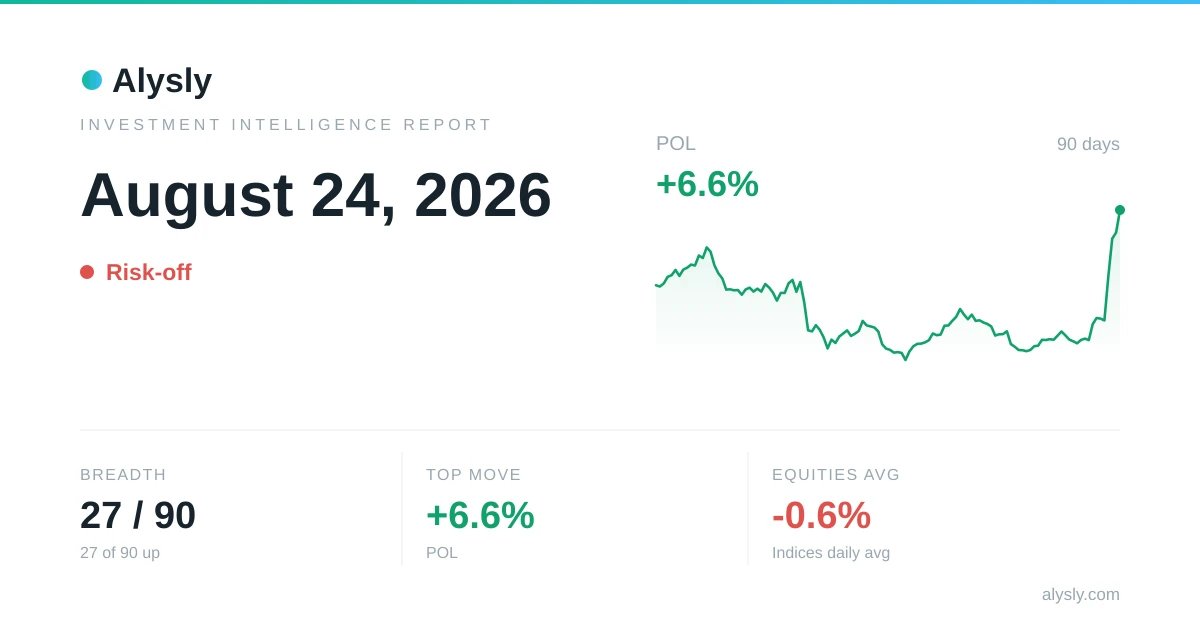
Selling pressure hits markets, with only 30% of assets higher – August 24, 2026