Broad-based rally: 64 of 80 assets close higher – August 10, 2026
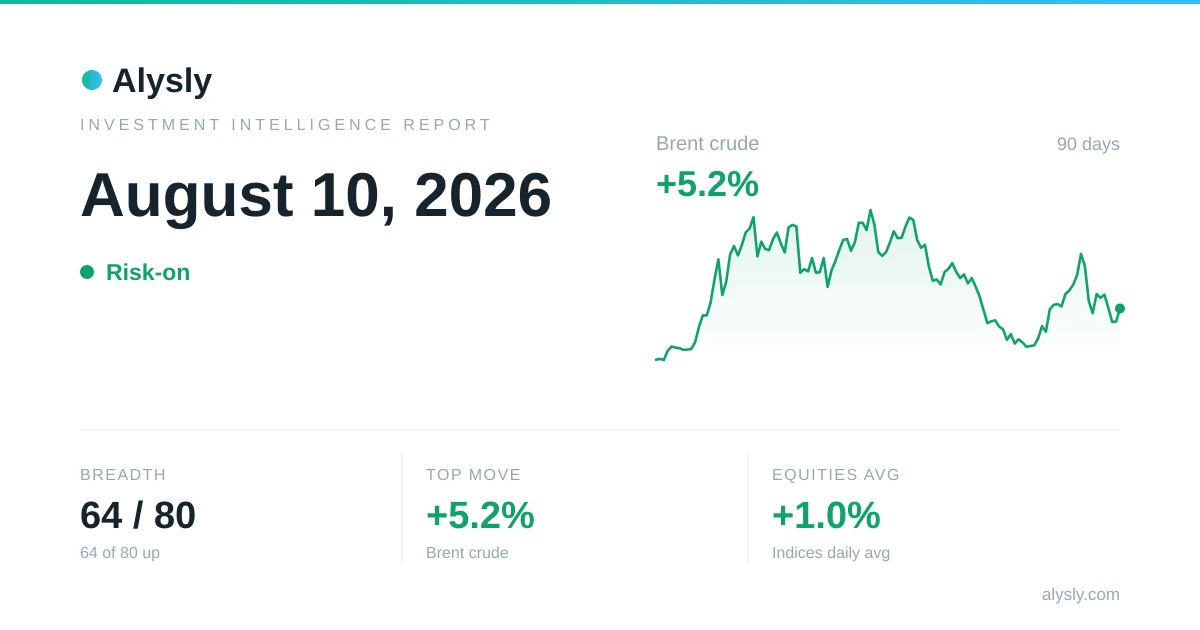
At the close on August 10, 2026, the markets tracked by Alysly showed clear risk-on appetite: 64 of 80 monitored assets (80 %) closed higher. The standout mover was the commodity Brent-Rohöl at +5.2 %. The major equity indices moved +1.0 % on average, with crypto around +0.6 %.
The key points at a glance
- Breadth: 64 of 80 assets higher (80 %) – clear risk-on appetite.
- Biggest daily move: Brent-Rohöl at +5.2 %.
- Indices: 16 of 16 higher – strongest MSCI Japan (+1.84 %), weakest Dow Jones (+0.27 %).
- Asset classes: leading commodities (+3.0 %), lagging crypto (+0.6 %).
- Crypto: top gainer TUT (+11.1 %), top loser BICO (-5.3 %).
- Correlation: EUR/USD ↔ Gold at +0.57 (moderately correlated).
Market barometer
Breadth = share of all tracked instruments (indices, liquid crypto, commodities, forex) with a positive daily change. Bars scale with the magnitude of each asset class's average daily return.
In focus: Brent-Rohöl
At +5.2 %, Brent-Rohöl was the day's most notable single move. The chart shows its trajectory over the selected range:
Indices on the day


Of the 16 benchmark indices tracked, 16 closed higher – so the majority advanced. MSCI Japan led the field at +1.84 %, while Dow Jones trailed at +0.27 %. The “52W” column shows where each index sits within its yearly range – a marker far to the right means it is trading close to its 52-week high.
Crypto: daily gainers & losers
From the 50 largest crypto assets by trading volume – illiquid micro-caps excluded.
Gainers
 TUT
TUT THE
THE MUBARAK
 PUMP
PUMP BMT
BMT BABY
BABY BICO
BICO TST
TST EPIC
EPIC IOTX
IOTX EUL
EUL BOME
BOMEAcross liquid coins, crypto came in at +0.6 %. Out in front was TUT at +11.1 %, with BICO trailing at -5.3 %. Crypto remains the most volatile asset class covered here – daily swings of this magnitude are normal and say little about the long-term trend.
Commodities & precious metals
Precious metals averaged +1.4 %, energy and industrial commodities +3.0 %. Both groups advanced. Gold is a traditional hedge, while crude oil and copper act as growth barometers.
| Name | Price | Change |
|---|---|---|
| Gold | 4399.7 | +2.20 % |
| Silver | 63.499 | +1.94 % |
| Platinum | 1759.6 | +0.73 % |
| Palladium | 1378.3 | +0.60 % |
| WTI crude | 78.18 | +3.94 % |
| Brent crude | 83.55 | +5.16 % |
| Gasoline | 2.9853 | +5.16 % |
| Heating oil | 3.9024 | +2.80 % |
| Copper | 6.591 | -2.03 % |
Foreign exchange (Forex)
The key pair EUR/USD moved +0.07 % – the euro gained on the US dollar, so the dollar was relatively weaker. A firmer dollar tends to weigh on commodities and emerging markets, a weaker one supports them. Prices are drawn from CME FX futures.
| Pair | Price | Change |
|---|---|---|
  EUR/USD EUR/USD | 1.1581 | +0.07 % |
 GBP/USD GBP/USD | 1.3499 | +0.22 % |
 USD/JPY USD/JPY | 157.10919088766693 | -0.04 % |
 AUD/USD AUD/USD | 0.70635 | +0.11 % |
 USD/CAD USD/CAD | 1.3914979475405274 | -0.49 % |
 USD/CHF USD/CHF | 0.8045052292839903 | +0.13 % |
Cross-asset correlations
Over the past 90 trading days, EUR/USD and Gold were moderately correlated, with a correlation coefficient of +0.57. A value near +1 means they move together, near −1 they move opposite, near 0 there is no linear link. For portfolio diversification, low or negative correlations are valuable – they smooth out volatility.
| Pair | r (90d) | −1 … +1 |
|---|---|---|
| S&P 500 ↔ Bitcoin | +0.39 | |
| S&P 500 ↔ Gold | +0.45 | |
| Gold ↔ Crude oil (WTI) | -0.33 | |
| EUR/USD ↔ Gold | +0.57 |
Summary
In summary, August 10, 2026 was a day of clear risk-on appetite across the markets Alysly tracks: 64 of 80 assets closed higher. The headline came from Brent-Rohöl at +5.2 %. Across asset classes, commodities led (+3.0 %) while crypto lagged (+0.6 %). The correlation between EUR/USD and Gold was moderately correlated (+0.57) – a gauge of how much diversification benefit combining the two currently offers. For long-term investors, though, single trading days are noise: what matters is broad diversification across asset classes, regions and time – not any one day's move.
Latest Investment Intelligence News
 · Risk-on
MSCI Japan tops the major indices at +1.8% – August 9, 2026
 · Risk-on
Crypto, commodities & FX this week: NEAR -5.5% · August 3–7, 2026
 · Risk-on
Broad-based rally: 66 of 84 assets close higher – August 8, 2026
 · Risk-on
The week in markets: S&P 500 Informationstechnologie sets the tone for the week (+7.2%) · August 3–7, 2026
 · Mixed
Crypto tops stocks as Bitcoin adds +0.8% versus the S&P 500's -0.2% – August 7, 2026