 UMA (UMA)
UMA · UMA/USD · rank #78
UMA (UMA) trades against the US dollar and last changed hands at $0.36 – ranked #78 by market capitalisation among the crypto assets we track. Year to date UMA is at -51.0 %, over three months at -21.0 % and over twelve months at -72.8 %. The current price sits near its 52-week low. Crypto assets are far more volatile than stocks or ETFs – double-digit daily moves are common and a total loss is possible. Above you'll find the price history of UMA together with the key performance metrics based on daily close prices.
Risk metrics
From the full available price history. Past ≠ future.
Correlated with
Co-movement of daily returns over the last 90 trading days across stocks, crypto, indices and commodities/FX – low or negative values improve portfolio diversification.
| Instrument | r | −1 … +1 |
|---|---|---|
| ANKR | +0.71 | |
| Solana | +0.67 | |
| 1INCH | +0.67 | |
| 1MBABYDOGE | +0.67 | |
| NEO | +0.66 | |
| Chainlink | +0.65 | |
| JOHNSON & JOHNSON | -0.25 | |
| WTI crude oil | -0.19 | |
| ABBVIE INC | -0.17 |
Latest Investment Intelligence News
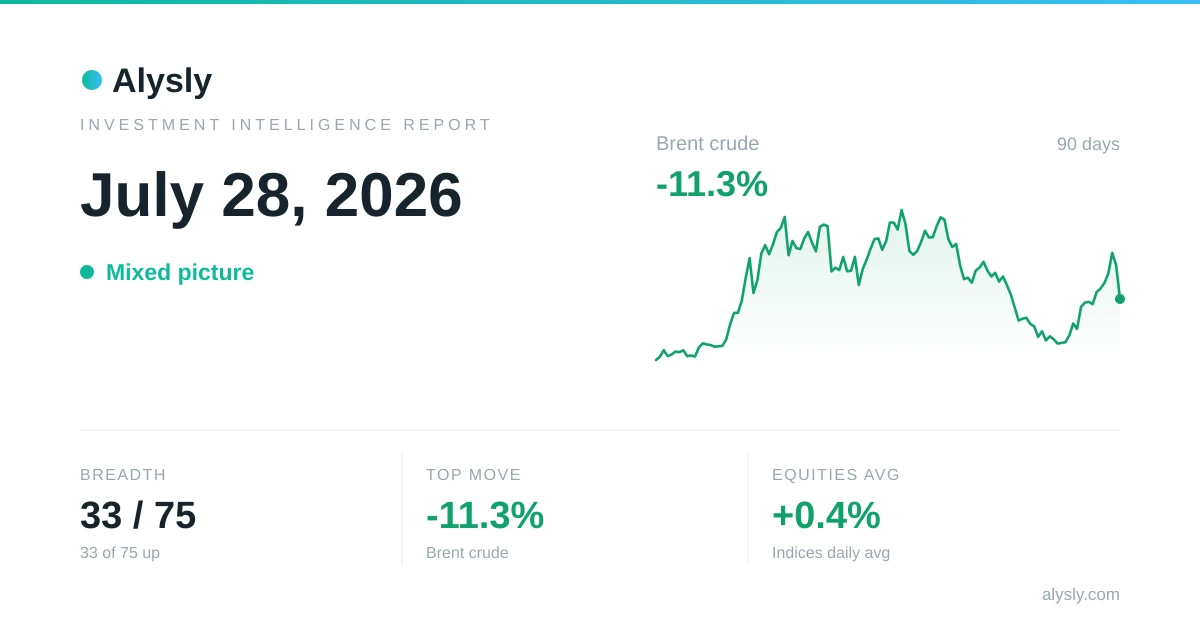 · Mixed
DAX tops the major indices at +1.6% – July 28, 2026
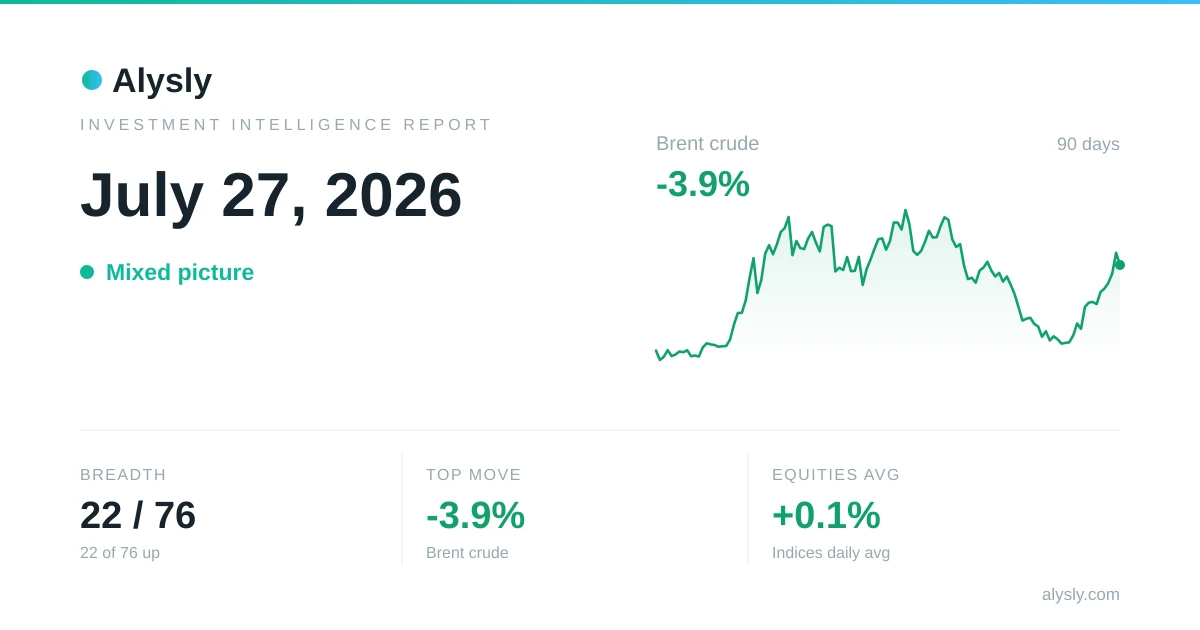 · Mixed
Broad-based sell-off: just 20 of 76 assets close higher – July 27, 2026
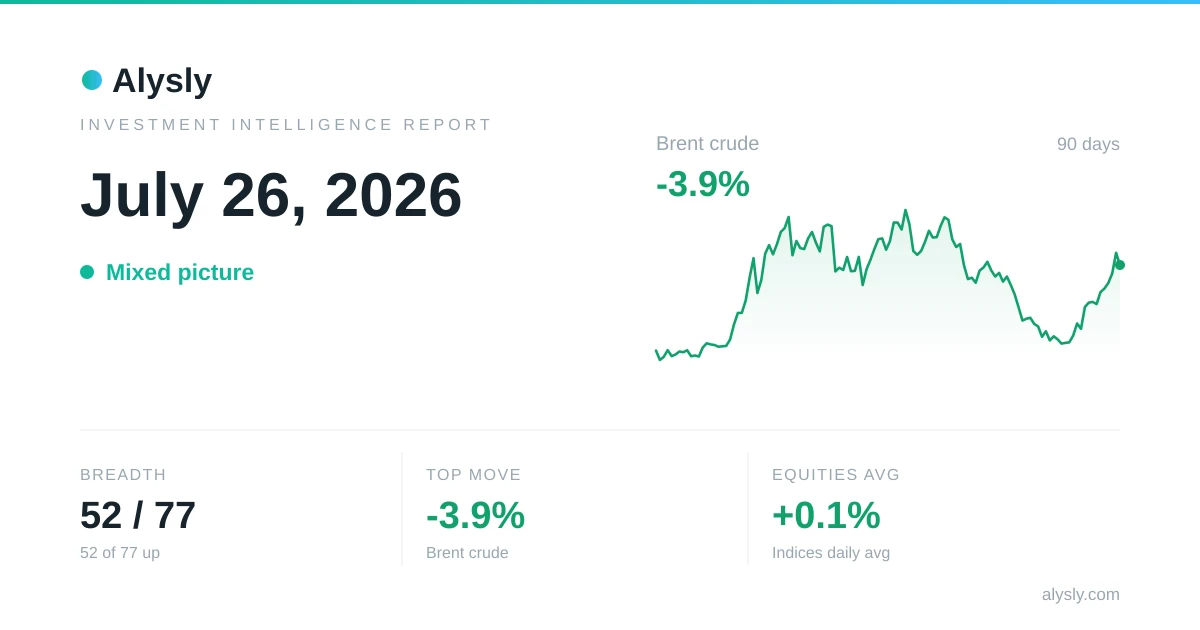 · Mixed
Crypto tops stocks as Bitcoin adds +1.6% versus the S&P 500's +0.1% – July 26, 2026
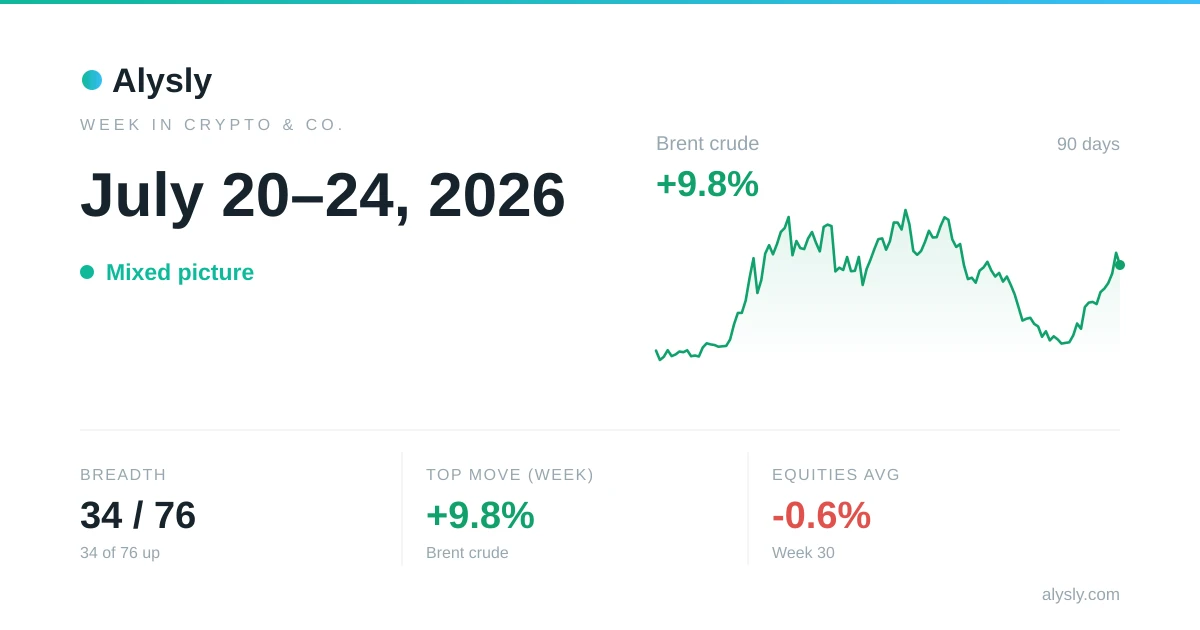 · Mixed
Crypto, commodities & FX this week – crypto +0.3% on average · July 20–24, 2026
 · Mixed
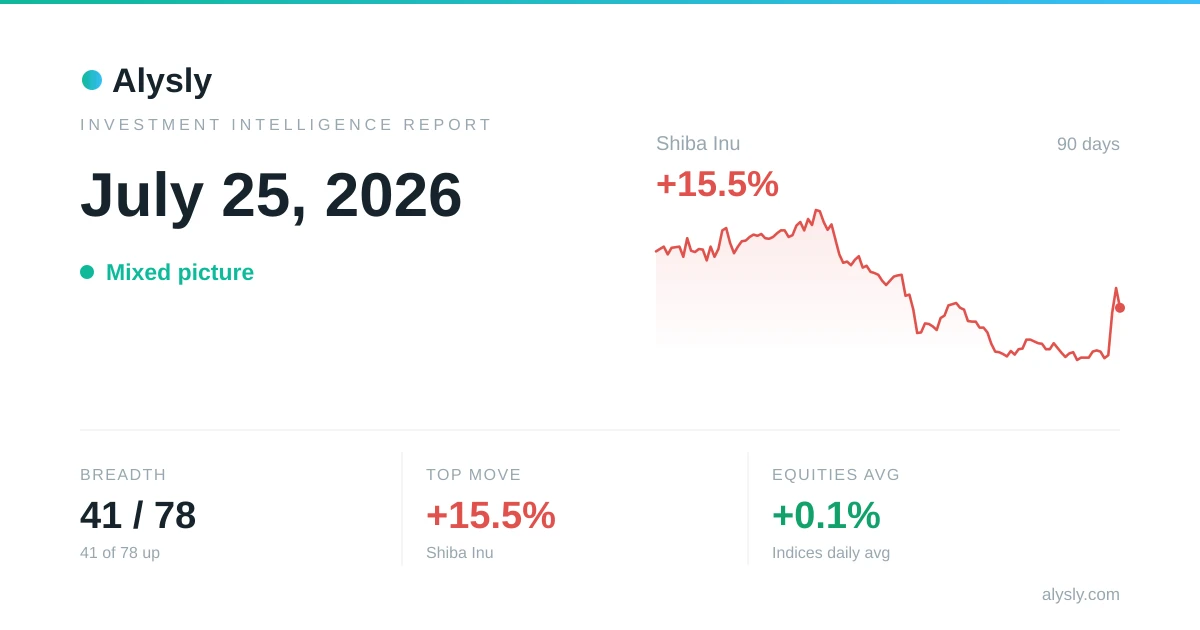
Shiba Inu surges 15.5% – July 25, 2026