 REZ (REZ)
REZ · REZ/USD · rank #66
2026-49.9 %
3M-34.7 %
1J-83.1 %
REZ (REZ) trades against the US dollar – ranked #66 by market capitalisation among the crypto assets we track. Year to date REZ is at -49.9 %, over three months at -34.7 % and over twelve months at -83.1 %. The current price sits near its 52-week low. Crypto assets are far more volatile than stocks or ETFs – double-digit daily moves are common and a total loss is possible. Above you'll find the price history of REZ together with the key performance metrics based on daily close prices.
Risk metrics
Max drawdown-96.4 %
Volatility p.a.107.9 %
Best year2026: -53.5 %
Worst year2025: -84.2 %
From the full available price history. Past ≠ future.
Correlated with
Co-movement of daily returns over the last 90 trading days across stocks, crypto, indices and commodities/FX – low or negative values improve portfolio diversification.
| Instrument | r | −1 … +1 |
|---|---|---|
| EDU | +0.58 | |
| 1000CAT | +0.58 | |
| CRCLB | +0.56 | |
| XAI | +0.55 | |
| ZKC | +0.54 | |
| NIL | +0.54 | |
| SPACE EXPLORATION TECHNOLOGIES COR | -0.54 | |
| 3M | -0.24 | |
| PROCTER & GAMBLE | -0.22 |
Latest Investment Intelligence News
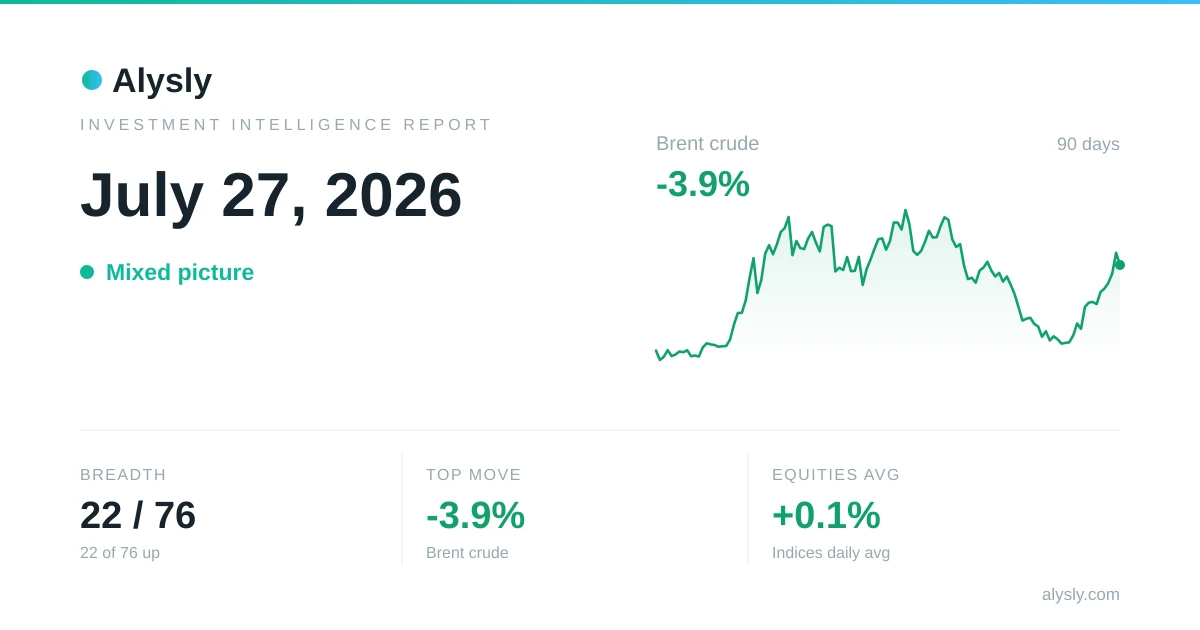 · Mixed
Broad-based sell-off: just 20 of 76 assets close higher – July 27, 2026
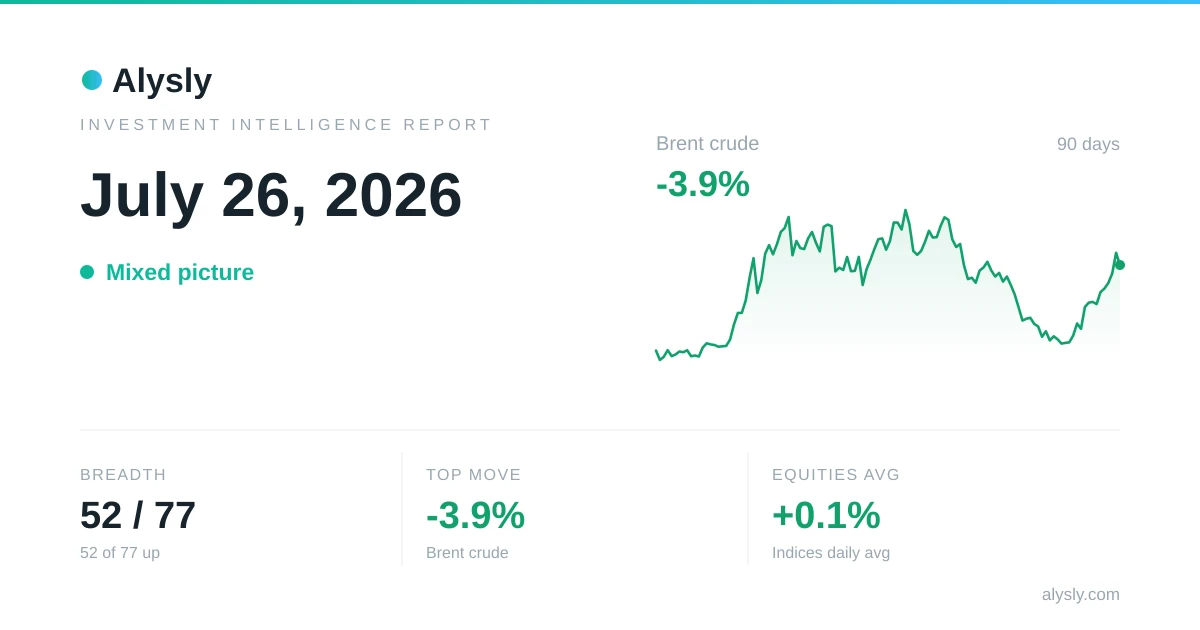 · Mixed
Crypto tops stocks as Bitcoin adds +1.6% versus the S&P 500's +0.1% – July 26, 2026
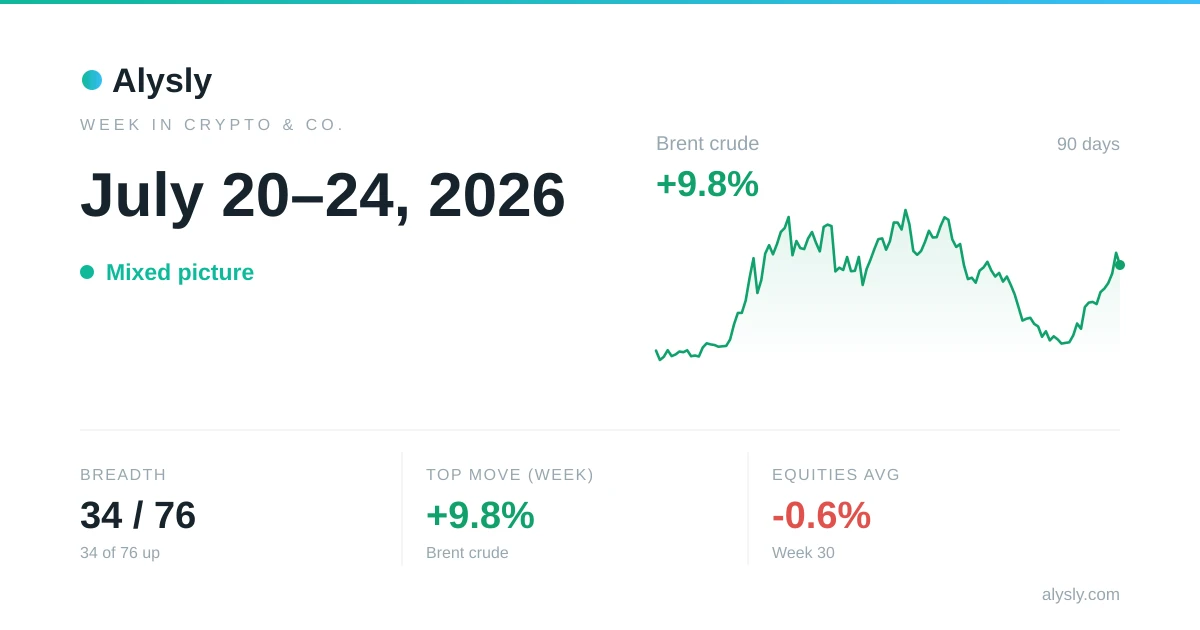 · Mixed
Crypto, commodities & FX this week – crypto +3.6% on average · July 20–24, 2026
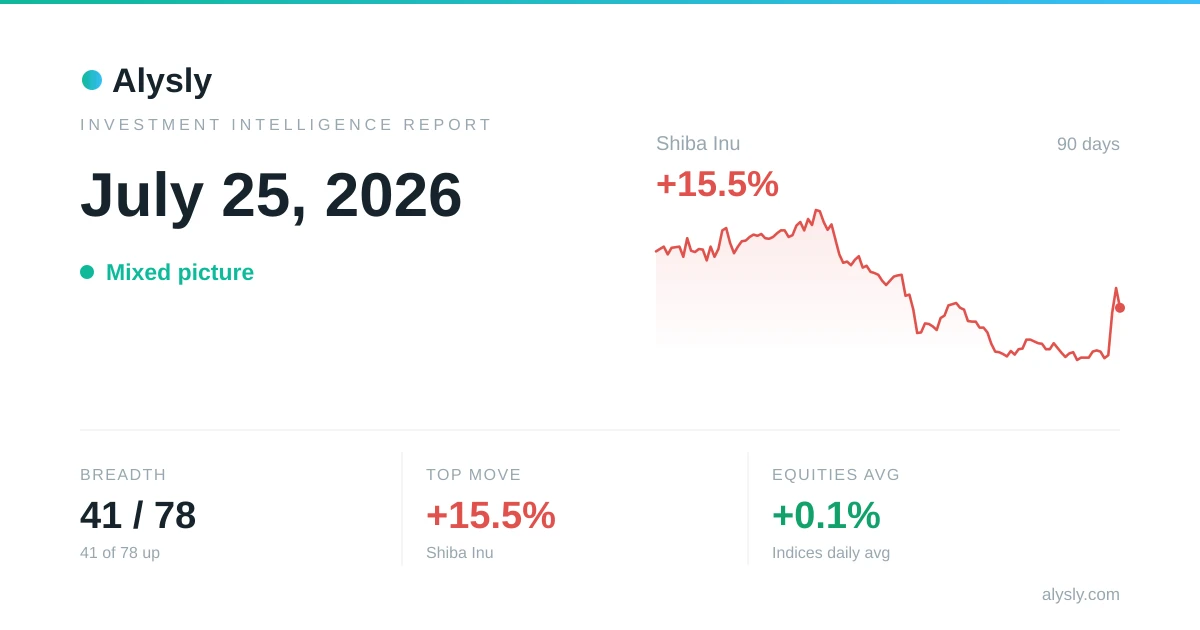 · Mixed
Shiba Inu surges 15.5% – July 25, 2026
 · Mixed
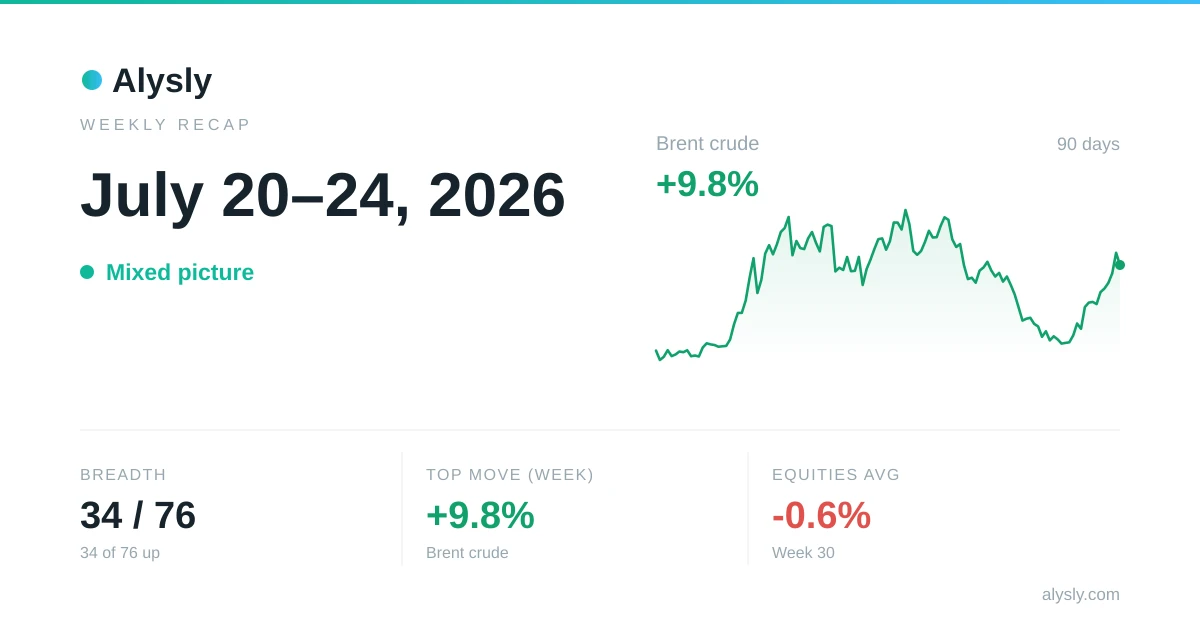
The week in markets: Nasdaq 100 weighs on the week (-1.6%) · July 20–24, 2026