Crypto, commodities & FX this week: Chainlink +9.6% · August 10–14, 2026
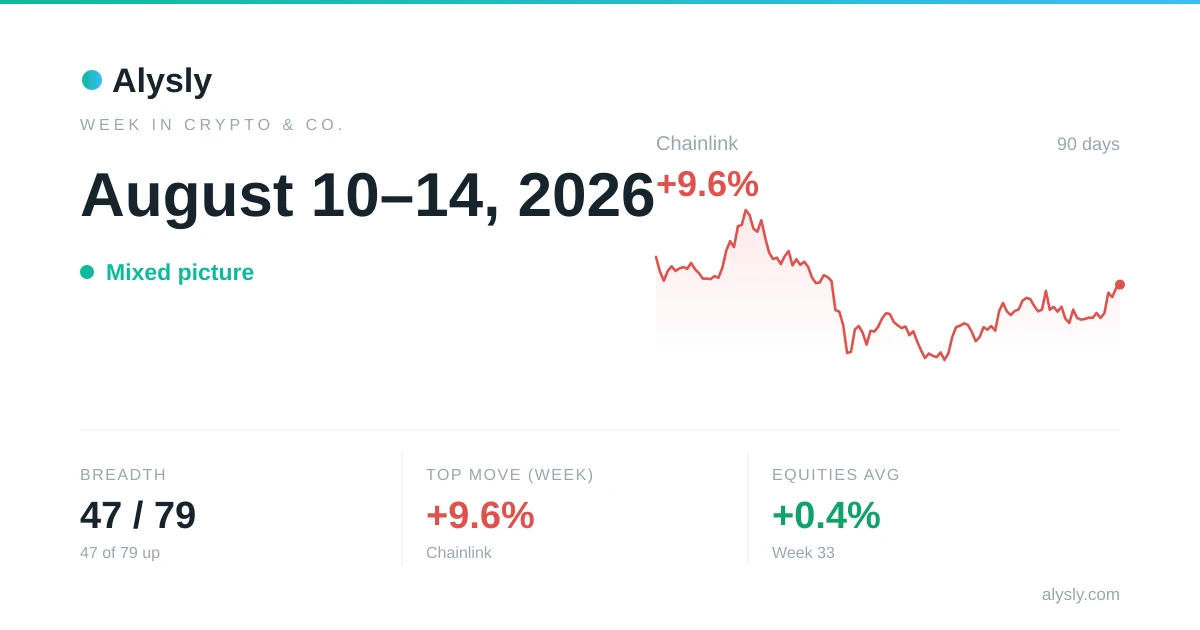
The second part of the weekly review for August 10–14, 2026 looks at crypto, commodities and FX. Crypto moved -2.8 % on average for the week, led by ACE (+106.4 %). Precious metals came in at +1.2 %, energy and industrial commodities at +7.5 %.
Crypto: weekly gainers & losers
Gainers
 ACE
ACE EDEN
EDEN ROBO
ROBO ETHFI
ETHFI HOME
HOME Chainlink
 TUT
TUT BMT
BMT BICO
BICO KAITO
KAITO MOVR
MOVR ENSO
ENSOCommodities & metals over the week
| Name | Price | Change |
|---|---|---|
| Gold | 4437.3 | +3.07 % |
| Silver | 65.108 | +4.53 % |
| Platinum | 1756.9 | +0.57 % |
| Palladium | 1325.5 | -3.26 % |
| WTI crude | 81.25 | +7.23 % |
| Brent crude | 87.07 | +9.72 % |
| Gasoline | 3.128 | +9.67 % |
| Heating oil | 4.2506 | +12.73 % |
| Copper | 6.613 | -1.70 % |
FX over the week
| Pair | Price | Change |
|---|---|---|
  EUR/USD EUR/USD | 1.1579 | +0.06 % |
 GBP/USD GBP/USD | 1.3533 | +0.48 % |
 USD/JPY USD/JPY | 159.02043412578516 | +1.18 % |
 AUD/USD AUD/USD | 0.70785 | +0.32 % |
 USD/CAD USD/CAD | 1.385905342665096 | -0.89 % |
 USD/CHF USD/CHF | 0.8105369807497468 | +0.88 % |
Real assets: the week's hammer prices
The auction houses delivered 42 records this week. Real assets are not quoted continuously – trading happens when a lot is called. What follows is therefore not a weekly return but the sum of what actually changed hands.
| Asset class | Records | Median | Highest hammer price | Price |
|---|---|---|---|---|
| Trading cards | 41 | $4,200 | Crystal Charizard #146 — Skyridge (2003) 10 Aug 2026 | $102,000 |
| Classic cars | 1 | $320,000 | Porsche 911 Turbo (993) — 1995–1998 11 Aug 2026 | $320,000 |
No sale was recorded in watches this week – the most recent one is 62 days back.
The trading-card price index stands at 538.1 (as of 10 August 2026), +251.9 % against a year ago. It measures price changes of the same good – unlike a median, which is made up of different items every week.
Residential property has no weekly figure: the latest official reading is from 1 May 2026, 105 days before this review. United States (Case-Shiller) +1.1 % year on year. Germany +1.4 % year on year. Euro area +4.6 % year on year.
Cross-asset correlations
| Pair | r | −1 … +1 |
|---|---|---|
| S&P 500 ↔ Bitcoin | +0.40 | |
| S&P 500 ↔ Gold | +0.47 | |
| Gold ↔ Crude oil (WTI) | -0.37 | |
| EUR/USD ↔ Gold | +0.60 |
Latest Investment Intelligence News
 · Mixed
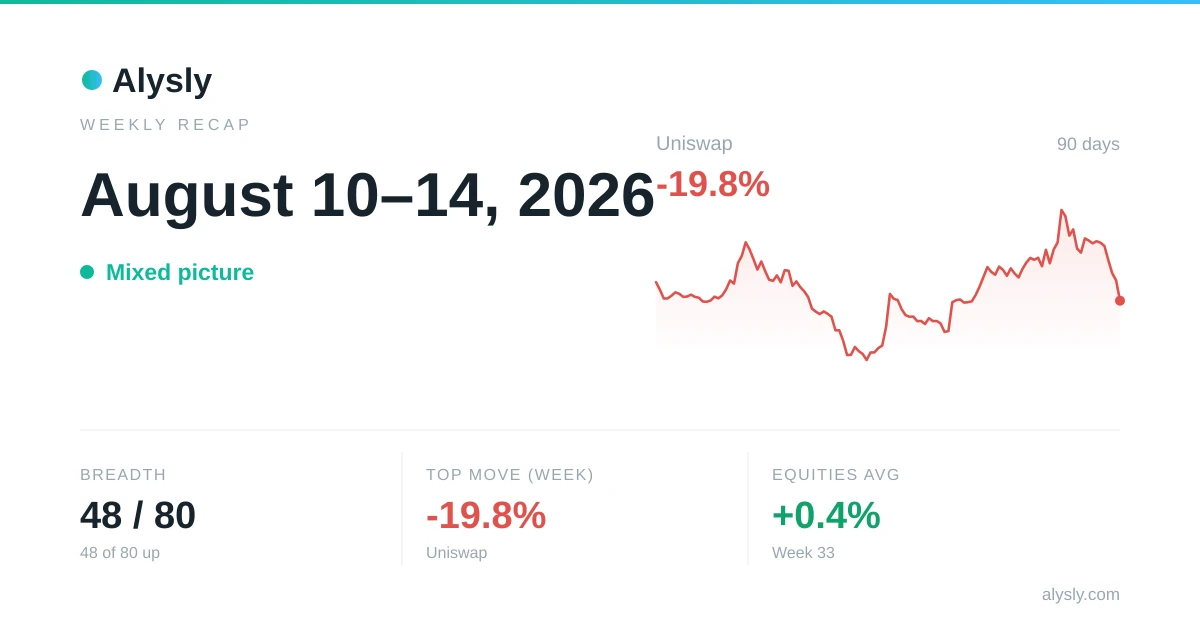
The week in markets: MSCI China lags the week (-3.4%) · August 10–14, 2026
 · Mixed
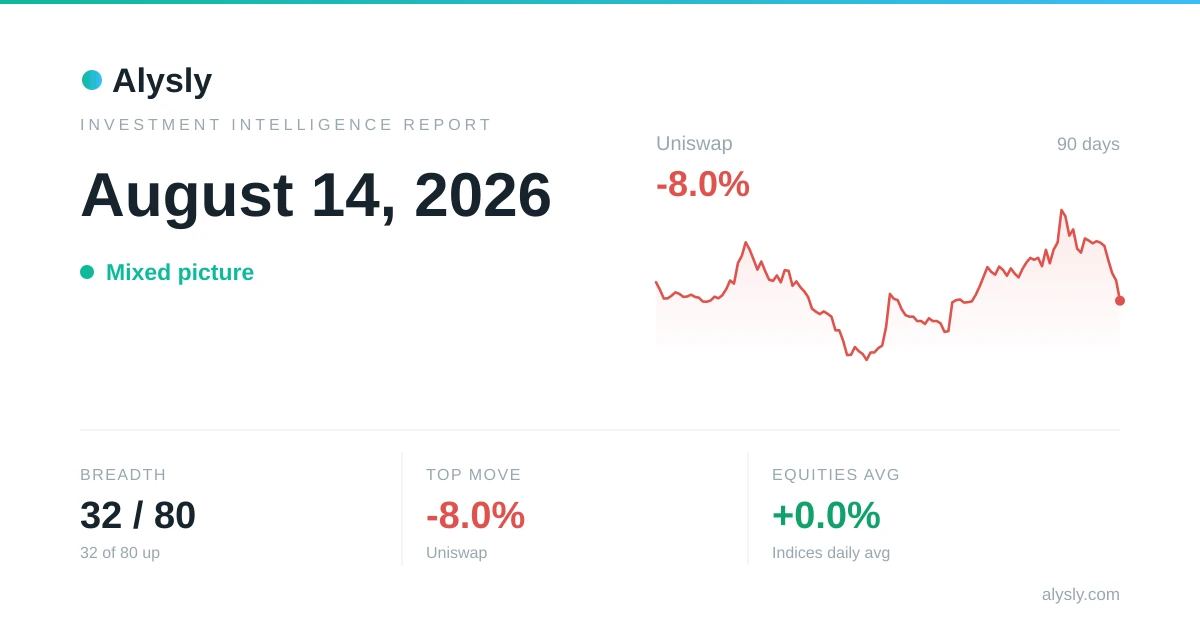
Uniswap tumbles 8.0% – August 14, 2026
 · Mixed
Nasdaq 100 is the strongest of the major indices, +1.2% – August 13, 2026
 · Mixed
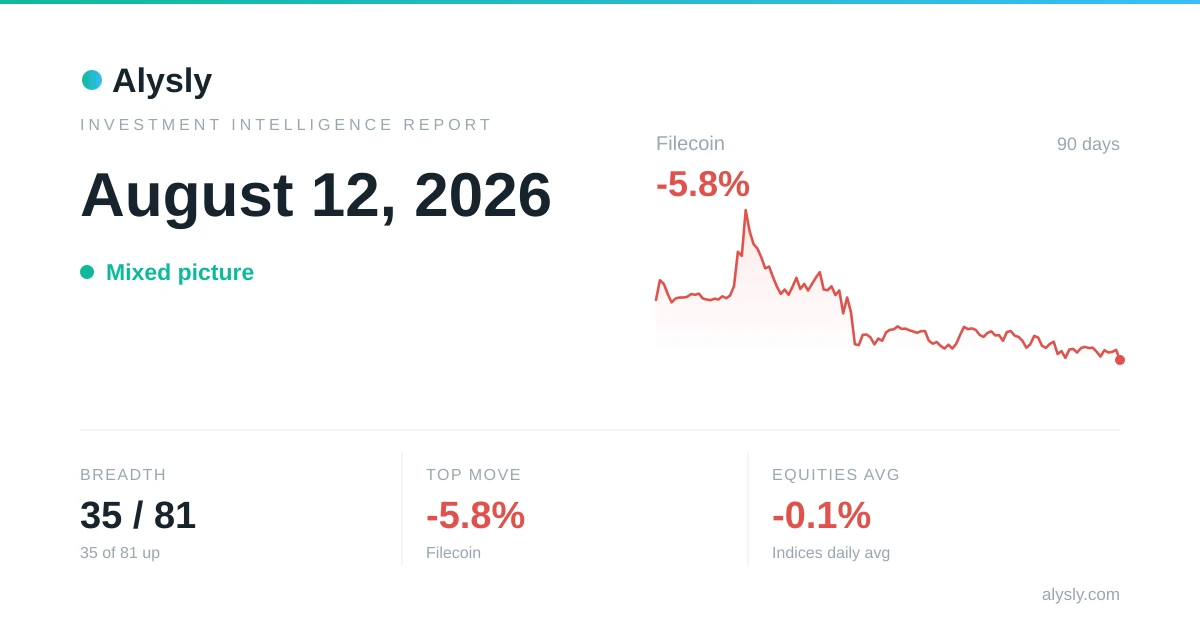
MSCI Emerging Markets tops the major indices at +1.6% – August 12, 2026
 · Mixed
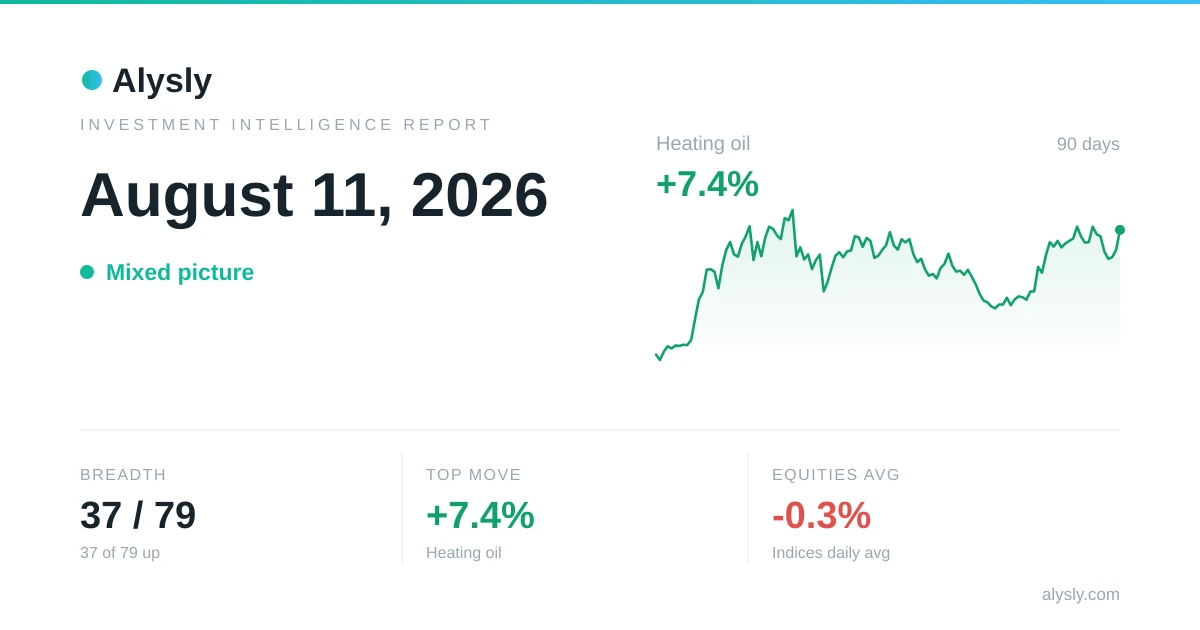
The S&P 500 outperforms Bitcoin, -0.3% to -0.6% – August 11, 2026