 ONG (ONG) Price | Chart & Market Cap | Performance | News
ONG · ONG/USD · rank #70
ONG (ONG) trades against the US dollar and last changed hands at $0.05 – ranked #70 by market capitalisation among the crypto assets we track. Year to date ONG is at -47.3 %, over three months at -31.6 % and over twelve months at -73.2 %. The current price sits near its 52-week low. Crypto assets are far more volatile than stocks or ETFs – double-digit daily moves are common and a total loss is possible. Below you'll find the price history of ONG together with the key performance metrics based on daily close prices.
Risk metrics
Correlated with
The strongest co-movers on top, the most inverse below. Low or negative values improve portfolio diversification.
| Instrument | r | −1 … +1 |
|---|---|---|
| MAGIC | +0.57 | |
| XAI | +0.55 | |
| STORJ | +0.54 | |
| QTUM | +0.53 | |
| CETUS | +0.53 | |
| PIXEL | +0.53 | |
| Space Exploration Technologies Corp. Class A | -0.91 | |
| Principal Financial Group Inc. | -0.34 | |
| Cooper Companies Inc. | -0.28 |
Altcoin Season Index
This coin is not among the evaluated top altcoins. Open the Altcoin Season Index (as of 2026-08-14).
Latest Investment Intelligence News: Crypto
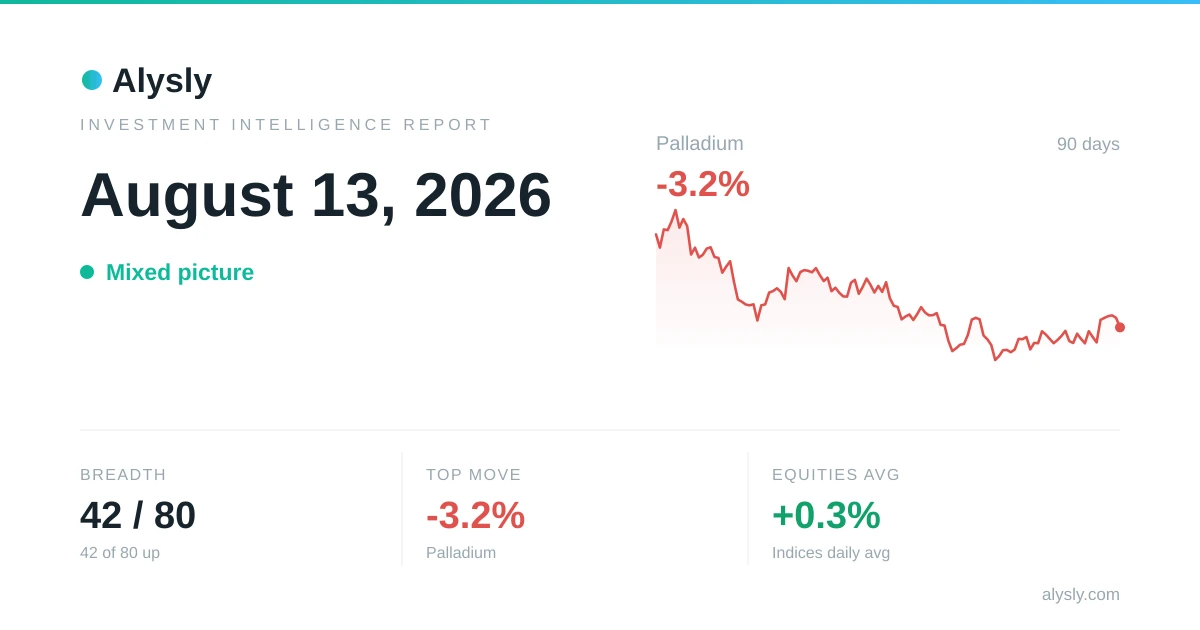 · Mixed
Nasdaq 100 is the strongest of the major indices, +1.2% – August 13, 2026
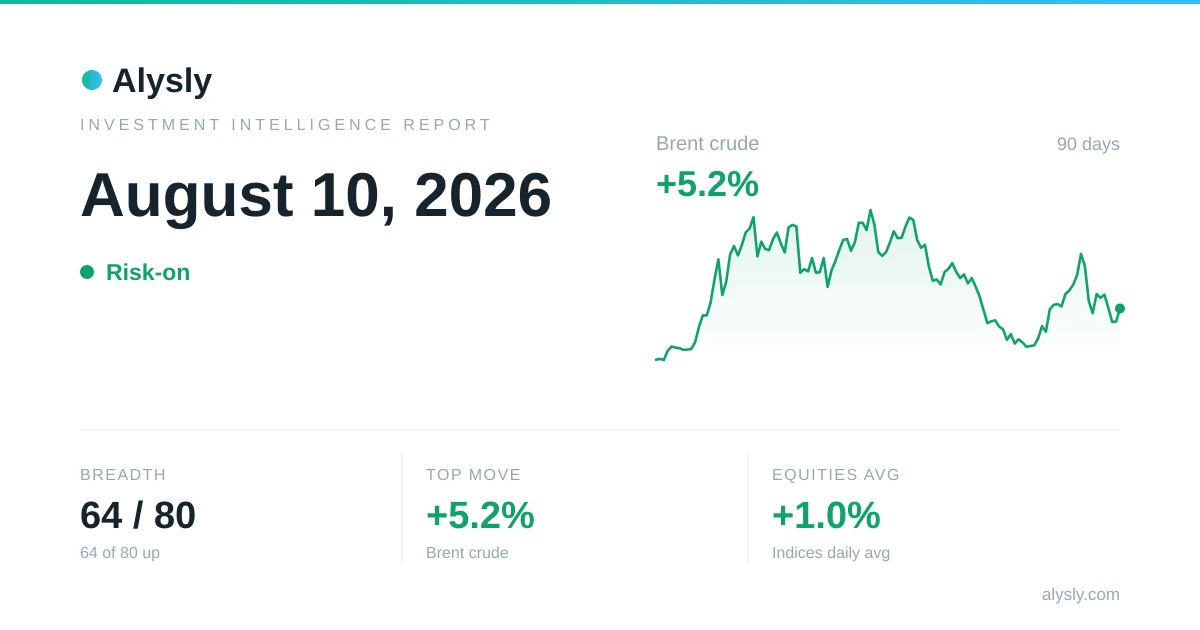 · Risk-on
MSCI Japan is the strongest of the major indices, +1.8% – August 10, 2026
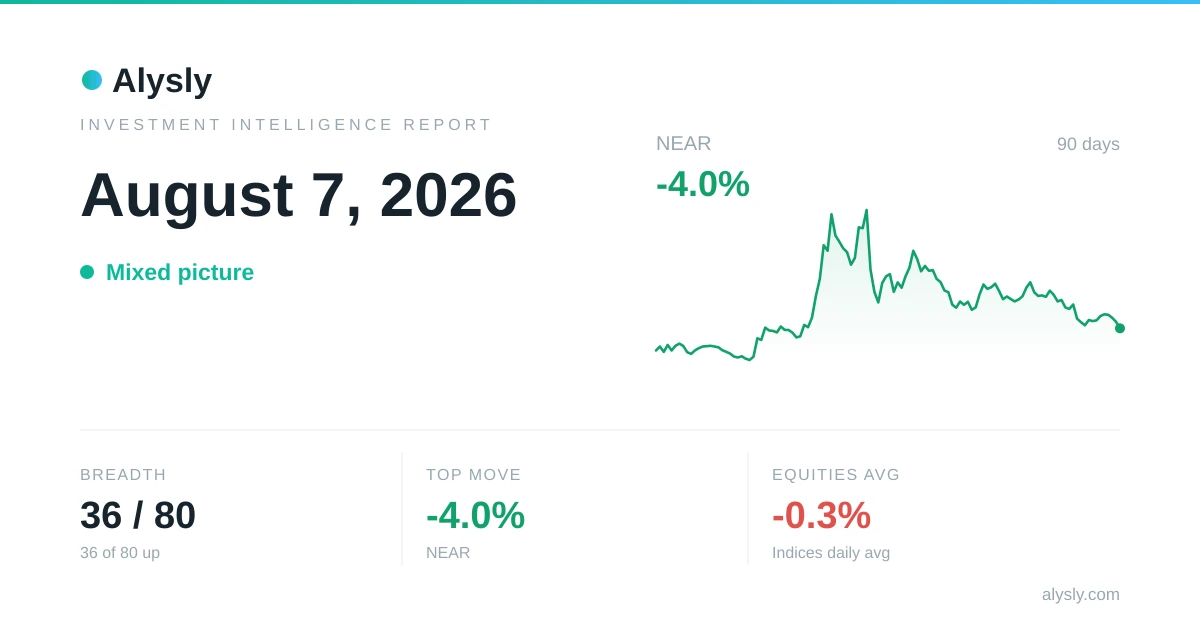 · Mixed
Bitcoin leads the S&P 500, +0.8% against -0.2% – August 7, 2026
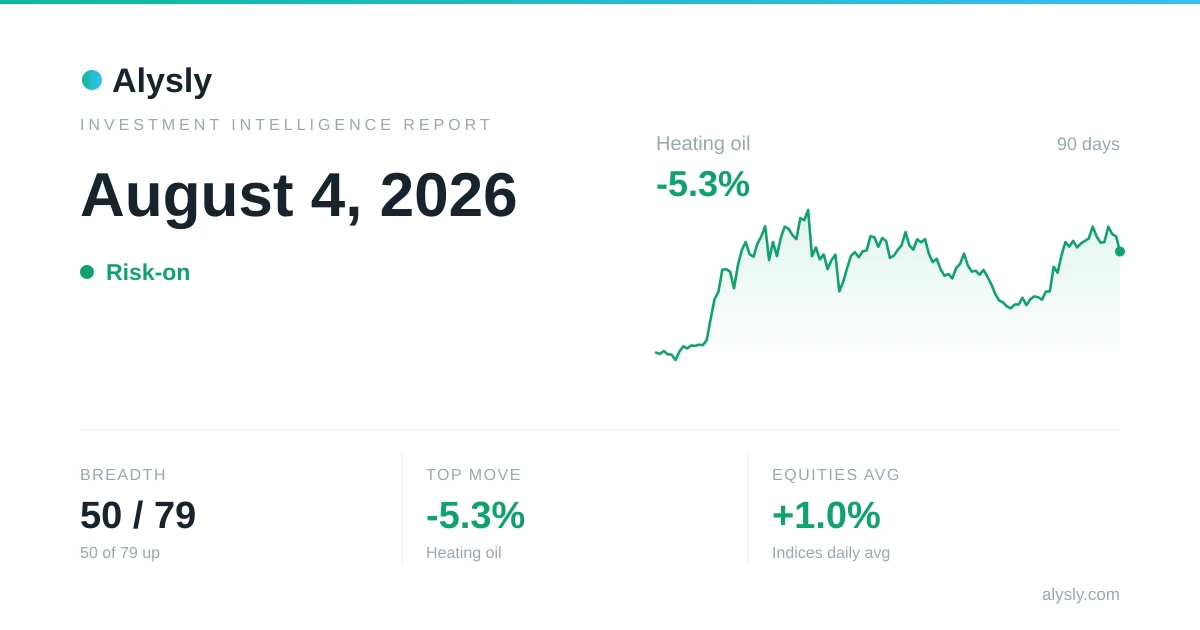 · Risk-on
Nasdaq 100 is the strongest of the major indices, +1.8% – August 4, 2026
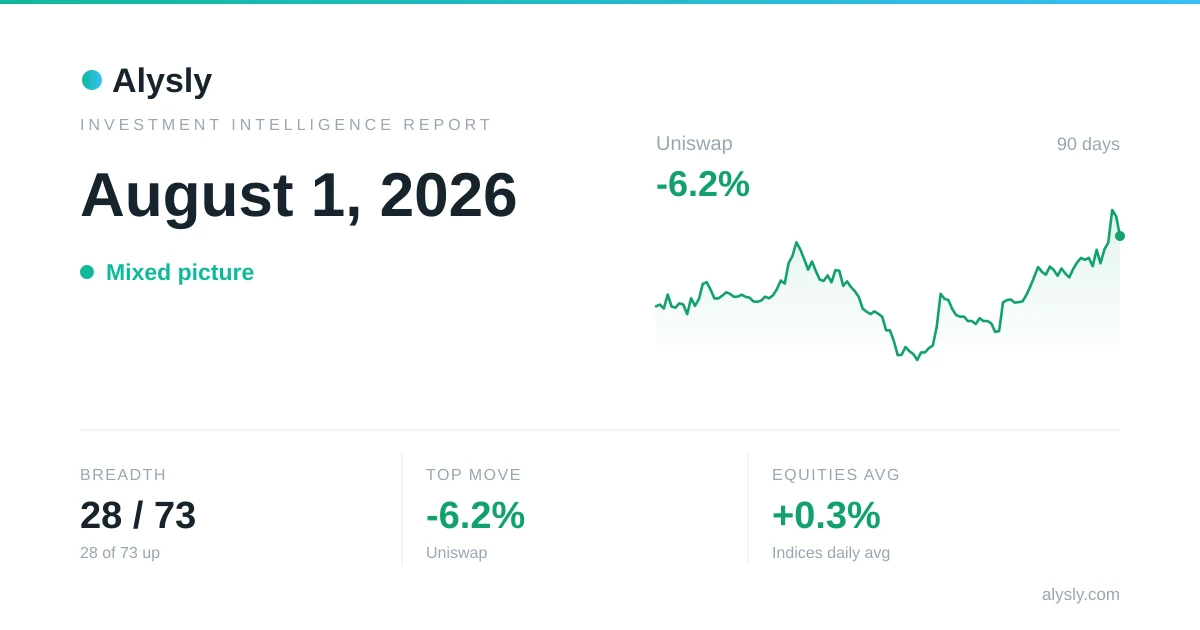 · Mixed
The S&P 500 leads Bitcoin, +0.7% against -0.1% – August 1, 2026